Boosting immunity by antiviral drug therapy: a simple relationship among timing, efficacy, and success - PubMed (original) (raw)
Boosting immunity by antiviral drug therapy: a simple relationship among timing, efficacy, and success
Natalia L Komarova et al. Proc Natl Acad Sci U S A. 2003.
Abstract
Drug therapies against persistent human infections such as hepatitis C virus, hepatitis B virus, and HIV fail to consistently eradicate the infection from the host. Hence, recent emphasis has shifted to the study of antiviral therapy aimed at boosting specific immune responses. It was argued that structured therapy interruptions were required to achieve this, because such regimes have shown promising results in early HIV infection. Using mathematical models, we show that, contrary to this notion, a single phase of drug therapy can result in the establishment of sustained immunity. We present a simple relationship between timing of therapy and efficacy of the drugs required for success. In the presence of strong viral suppression, we show that therapy should be stopped relatively early, and that a longer duration of treatment leads to failure. On the other hand, in the presence of weaker viral suppression, stopping treatment too early is detrimental, and therapy has to be continued beyond a time threshold. We discuss our modeling results primarily in the context of HCV therapy during chronic infection. Although the therapy regimes explored here also have implications for HIV, virus-mediated destruction of specific immune cells renders success unlikely during the chronic phase of the infection.
Figures
Figure 1
Diagram explaining the behavior of the general mathematical model. The model is defined by the virus growth function g r(y) and the immune expansion function f(y). As explained in the text, the function g r(y) depends on the viral replication rate, r, whereas the function f(y) does not. (a) The functions f(y) and g r(y) are plotted versus y. The function f(y) has two fixed roots, _y_1 and _y_2. We show g r(y) as a function of y for several different values of r. The parameter r determines at which value of y = y* the function g r(y) equals zero. If the value of r lies above a threshold so that g r(y) = 0 for y > _y_2, we are in the bistable parameter region. If the value of r is smaller so that g r(y) = 0 for _y_1 < y < _y_2, the only stable outcome is immune control, S i. If the value of r is still smaller so that g r(y) = 0 for 0 < y < _y_1, only the virus equilibrium, S v, is stable. Finally, if the value of r is very small, then g r(y) = 0 for y < 0 and the infection cannot become established in the first place, _S_0. (b) This is a schematic diagram that summarizes how the outcome of infection depends on the viral replication rate, r, as detailed above.
Figure 2
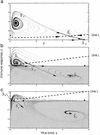
Phase-space diagram showing the behavior of the model. The axes show virus load, y, and the immune response, z. Equilibria are indicated, and the arrows show the equilibrium outcomes toward which the system moves over time, depending on the starting conditions. Stable equilibria are indicated by filled circles. Unstable equilibria are indicated by open circles. Shading indicates the biologically irrelevant region where the immune response assumes negative values; it is included only for mathematical completeness. The dashed lines indicate line L, the pretreatment separatrix, which diverges to infinity for y near zero. In the present context, this regime is not relevant because in practical terms it corresponds to absence of infection. (a) The pretreatment regime: behavior of the model in the bistable parameter region. Below line L (dashed line), the system converges to the virus equilibrium, S v; above line L, it converges to the immune control equilibrium, S i. (b and c) Effect of therapy assuming a reduction of the parameter r. The black triangle shows the state of the infection before therapy (at the pretreatment virus equilibrium S v). To achieve sustained immunological control, therapy has to be stopped while the system is above the separatrix. If therapy is relatively weak (b), the system moves to the immune control equilibrium, S i, during treatment. For sufficiently weak therapy, this lies above line L. Thus, if therapy is stopped after a time threshold t > _t_min, immunological control is maintained. On the other hand, if therapy is stronger (c), the system moves to the virus equilibrium, S v, which lies below line L. It can move only temporarily above line L. In this case, therapy has to be stopped early to achieve sustained immunological control, before the system has reached equilibrium and has fallen back below line L. The flow lines are generated for system (Eqs. 1 and 2) of the Appendix with parameters k = 10, a = 3, c = 4, ɛ = 0.5 and q = p = b = 1. The parameter r takes values r = 7 in a, r = 3.05 in b, and r = 3.01 in c.
Figure 3
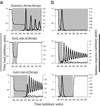
Simulation of therapy assuming relatively weak and relatively strong therapy. Phases of treatment are indicated by shading. (a) With weaker therapy, immune responses are boosted and are maintained during the phase of treatment. It takes the response a relatively long time to expand, and therapy should be stopped after a time threshold, once the level of immune responses has significantly risen. If therapy is stopped too early, immunological control is not achieved. (b) With stronger therapy, virus load is reduced quickly to low levels. On initiation of treatment, the immune response expands temporarily and declines again to low levels once the amount of antigenic drive has been diminished. To achieve long-term immunological control, therapy has to be stopped early, before the temporary immune expansion has vanished. If therapy is continued for too long, sustained immune control is not achieved. Parameters were chosen as follows: r = 3.5, k = 10, a = 3, P = 1, c = 12, ɛ = 5, u = 3, and b = 0.3. For a, r = 3.13 during therapy; for b, r = 3.013 during therapy.
Figure 4
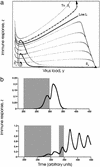
Dynamics of structured therapy interruptions. (a) Phase-space diagram. Solid line indicates treatment; dashed line indicates phases off treatment. We start from the virus equilibrium, S v, indicated by the black triangle. Therapy is assumed to be strong and the number of reactive immune cells to be low. Thus, during treatment, the dynamics approach an equilibrium which lies below line L, and the number of immune cells does not cross line L during this phase. Stopping and restarting therapy, however, can push the system above line L. Cessation of therapy while the system is above line L results in long-term immunological control. (b) Time series presentation of these dynamics. In this simulation, a single phase of therapy cannot result in long-term immunological control. An interruption, followed by a second phase of treatment, however, can sufficiently boost the level of immune responses. If the second phase of treatment is stopped before the response has significantly declined, long-term immunological control is achieved. In general, treatment should be stopped and restarted while the level of immune responses is around the peaks. Parameter values were chosen as follows: r = 0.7, k = 10, a = 0.1, P = 1, c = 0.6, ɛ = 1, u = 0.075, and b = 0.1. During therapy, r = 0.101.
Similar articles
- Antiviral combination therapy for treatment of chronic hepatitis B, hepatitis C, and human immunodeficiency virus infection.
Hofmann WP, Soriano V, Zeuzem S. Hofmann WP, et al. Handb Exp Pharmacol. 2009;(189):321-46. doi: 10.1007/978-3-540-79086-0_12. Handb Exp Pharmacol. 2009. PMID: 19048206 Review. - Impact and management of hepatitis B and hepatitis C virus co-infection in HIV patients.
Kumar R, Singla V, Kacharya Sk. Kumar R, et al. Trop Gastroenterol. 2008 Jul-Sep;29(3):136-47. Trop Gastroenterol. 2008. PMID: 19115605 Review. - Acute hepatitis C virus infection.
Chung RT. Chung RT. Clin Infect Dis. 2005 Jul 1;41 Suppl 1:S14-7. doi: 10.1086/429490. Clin Infect Dis. 2005. PMID: 16265608 Review. - HIV and hepatitis C coinfection.
Matthews GV, Dore GJ. Matthews GV, et al. J Gastroenterol Hepatol. 2008 Jul;23(7 Pt 1):1000-8. doi: 10.1111/j.1440-1746.2008.05489.x. J Gastroenterol Hepatol. 2008. PMID: 18707597 Review. - European AIDS Clinical Society (EACS) guidelines for the clinical management and treatment of chronic hepatitis B and C coinfection in HIV-infected adults.
Rockstroh JK, Bhagani S, Benhamou Y, Bruno R, Mauss S, Peters L, Puoti M, Soriano V, Tural C; EACS Executive Committee. Rockstroh JK, et al. HIV Med. 2008 Feb;9(2):82-8. doi: 10.1111/j.1468-1293.2007.00535.x. HIV Med. 2008. PMID: 18257771
Cited by
- Dynamics of recurrent viral infection.
Yao W, Hertel L, Wahl LM. Yao W, et al. Proc Biol Sci. 2006 Sep 7;273(1598):2193-9. doi: 10.1098/rspb.2006.3563. Proc Biol Sci. 2006. PMID: 16901839 Free PMC article. - Heterogeneity in chronic myeloid leukaemia dynamics during imatinib treatment: role of immune responses.
Wodarz D. Wodarz D. Proc Biol Sci. 2010 Jun 22;277(1689):1875-80. doi: 10.1098/rspb.2009.2179. Epub 2010 Feb 10. Proc Biol Sci. 2010. PMID: 20147328 Free PMC article. - Tempo and mode of inhibitor-mutagen antiviral therapies: a multidisciplinary approach.
Iranzo J, Perales C, Domingo E, Manrubia SC. Iranzo J, et al. Proc Natl Acad Sci U S A. 2011 Sep 20;108(38):16008-13. doi: 10.1073/pnas.1110489108. Epub 2011 Sep 12. Proc Natl Acad Sci U S A. 2011. PMID: 21911373 Free PMC article. - Codimension-one bifurcation and stability analysis in an immunosuppressive infection model.
Dadi Z, Alizade S. Dadi Z, et al. Springerplus. 2016 Feb 1;5:106. doi: 10.1186/s40064-016-1737-0. eCollection 2016. Springerplus. 2016. PMID: 26877904 Free PMC article. - Sustained and transient oscillations and chaos induced by delayed antiviral immune response in an immunosuppressive infection model.
Shu H, Wang L, Watmough J. Shu H, et al. J Math Biol. 2014 Jan;68(1-2):477-503. doi: 10.1007/s00285-012-0639-1. Epub 2013 Jan 11. J Math Biol. 2014. PMID: 23306425
References
- Rosenberg E S, Altfeld M, Poon S H, Phillips M N, Wilkes B M, Eldridge R L, Robbins G K, D'Aquila R T, Goulder P J, Walker B D. Nature. 2000;407:523–526. - PubMed
- Maini M K, Bertoletti A. J Viral Hepat. 2000;7:321–326. - PubMed
MeSH terms
Substances
LinkOut - more resources
Full Text Sources
Medical


