Analysing branching pattern in plantations of young red oak trees (Quercus rubra L., Fagaceae) - PubMed (original) (raw)
Analysing branching pattern in plantations of young red oak trees (Quercus rubra L., Fagaceae)
Patrick Heuret et al. Ann Bot. 2003 Mar.
Abstract
Branching patterns of the growth units of monocyclic or bicyclic annual shoots on the main axis of 5-year-old red oaks were studied in a plantation in south-western France. For each growth unit, the production of axillary structures associated with each node was described in the form of a sequence. For a given category of growth units, homogeneous zones (i.e. zones in which composition in terms of type of axillary production does not change substantially) were identified on such sequences using a dedicated statistical model called a hidden semi-Markov chain. For instance, on the first growth unit of bicyclic annual shoots, a zone with 1-year-delayed branches was found systematically below a zone with buds and one-cycle-delayed branches. Branching patterns shown by the growth unit of monocyclic annual shoots and on the second growth unit of bicyclic annual shoots were very similar. Branches with a 1-year delay in development tended to be polycyclic at the top of the growth unit and monocyclic lower down. The number of nodes shown by the branched zone of the growth unit of monocyclic annual shoots was stable, irrespective of the total number of nodes of the growth unit. In contrast, the second growth unit of bicyclic annual shoots exhibited a correlation between the number of nodes in the branching zone and the total number of nodes. The contribution made by this method to understanding plant functioning is discussed.
Figures
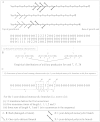
Fig. 1. Structure of a red oak growth unit and description of the different scars. a.c, Apical cataphylls; i.c, intermediate cataphylls; l, leaves; b.c, basal cataphylls; c.r, cataphylls in ring; t.b, terminal bud; l.b, lateral bud; l.s, leaf (or leaf scar); s.s, stipule (or stipule scar).
Fig. 2. Different types of branches were considered in the construction of branching sequences for growth units of monocyclic annual shoots (GU.mono; A), and first (GU.bi1) and second (GU.bi2) growth units of bicyclic annual shoots (B). One‐cycle‐delayed branches (1) were found solely on GU.bi1, while 1‐year‐delayed mono‐ (2) or polycyclic (3) branches were found on all types of GU. Short line represents intra‐annual interruption of growth; two short lines represent interannual interruption of growth.
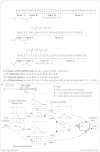
Fig. 3. A, Descriptions of axillary production distributions on three growth units (measured on GU.bi1 in this example) in the form of sequences of events. Coded elements include: bud (0); one‐cycle‐delayed branch (1); 1‐year‐delayed monocyclic (2) and 1‐year‐delayed polycyclic branch (3). Values are indexed according to the rank of the node bearing the branch, taken from the tip to the base of the growth unit. B, ‘Intensity’: the frequency of different events (i.e. bud, one‐cycle‐delayed branches or 1‐year‐delayed monocyclic and polycylic branches) is extracted for the different positions (node rank) along the growth unit from the apex. C, ‘Interval’ (time until the first occurrence, recurrence time, sojourn time) and ‘Counts’ (number of occurrences or number of runs per sequence) can be extracted for specific events.
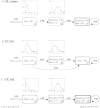
Fig. 4. A, Example of three sequences (measured on GU.bi1 in this example) divided into zones on the basis of a hidden semi‐Markov chain. The different model parameters are shown (initial probabilities, transition probabilities, sojourn time distribution, observation probabilities). B, Hidden semi‐Markov chain estimated from GU.bi1.
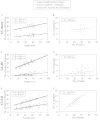
Fig. 5. Correlation between the total number of nodes and the length (in cm) of the growth unit, the total number of branches borne by the growth unit and its length (in cm), and the total number of branches borne by the growth unit and its total number of nodes for GU.mono (A and B), GU.bi1 (C and D) and GU.bi2 (E and F).
Fig. 6. Hidden semi‐Markov chain estimated from GU.mono branching sequences.
Fig. 7. Hidden semi‐Markov chain estimated from GU.bi2 branching sequences.
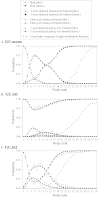
Fig. 8. Probability of the different types of axillary production in relation to node rank (‘intensity’) for GU.mono (A), GU.bi1 (B) and GU.bi2 (C). The cumulative distribution function of sequence length (directly deduced by summation of the frequency distribution) is shown as a dotted curve. obs., Observed; theor., theoretical.
Fig. 9. Sojourn time distributions for 1‐year‐delayed monocyclic (A) and polycyclic (B) branches on GU.bi2; time until first occurrence for one‐cycle‐delayed (C) and 1‐year‐delayed (D) monocyclic branches on GU.bi1; number of occurrences per sequence distribution for one‐cycle‐delayed (E) and one‐year‐delayed (F) monocyclic branches on GU.bi1.
Fig. 10. Hidden semi‐Markov chain estimated from the branching sequences of GU.mono (A), GU.bi1 (B) and GU.bi2 (C). The different types of branch are not differentiated, and only the branched/unbranched pattern is taken into account.
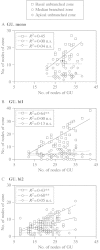
Fig. 11. Correlation between the number of nodes in segmented zones corresponding to states A (apical unbranched zone), B (median branched zone) and C (basal unbranched zone) of the models in Fig. 10, with the total number of nodes in the growth unit considered for GU.mono (A), GU.bi1 (B) and GU.bi2 (C).
Similar articles
- Quantitative analysis of shoot development and branching patterns in Actinidia.
Seleznyova AN, Thorp TG, Barnett AM, Costes E. Seleznyova AN, et al. Ann Bot. 2002 Apr;89(4):471-82. doi: 10.1093/aob/mcf069. Ann Bot. 2002. PMID: 12096808 Free PMC article. - Differences in proleptic and epicormic shoot structures in relation to water deficit and growth rate in almond trees (Prunus dulcis).
Negrón C, Contador L, Lampinen BD, Metcalf SG, Guédon Y, Costes E, DeJong TM. Negrón C, et al. Ann Bot. 2014 Feb;113(3):545-54. doi: 10.1093/aob/mct282. Epub 2013 Dec 15. Ann Bot. 2014. PMID: 24344139 Free PMC article. - A Comparative Study on the Branching Pattern of Monocyclic and Bicyclic Shoots of Apple cv. "Fuji".
Wang YT, Pallas B, Salazar-Gutierrez MR, Costes E, Hoogenboom G. Wang YT, et al. Front Plant Sci. 2020 Aug 31;11:571918. doi: 10.3389/fpls.2020.571918. eCollection 2020. Front Plant Sci. 2020. PMID: 32983221 Free PMC article. - Analyzing growth components in trees.
Guédon Y, Caraglio Y, Heuret P, Lebarbier E, Meredieu C. Guédon Y, et al. J Theor Biol. 2007 Oct 7;248(3):418-47. doi: 10.1016/j.jtbi.2007.05.029. Epub 2007 Jun 2. J Theor Biol. 2007. PMID: 17631316
Cited by
- Epicormic ontogeny in Quercus petraea constrains the highly plausible control of epicormic sprouting by water and carbohydrates.
Morisset JB, Mothe F, Bock J, Bréda N, Colin F. Morisset JB, et al. Ann Bot. 2012 Feb;109(2):365-77. doi: 10.1093/aob/mcr292. Epub 2011 Dec 5. Ann Bot. 2012. PMID: 22147545 Free PMC article. - Quantitative analysis of the phenotypic variability of shoot architecture in two grapevine (Vitis vinifera) cultivars.
Louarn G, Guedon Y, Lecoeur J, Lebon E. Louarn G, et al. Ann Bot. 2007 Mar;99(3):425-37. doi: 10.1093/aob/mcl276. Epub 2007 Jan 4. Ann Bot. 2007. PMID: 17204533 Free PMC article. - Axis differentiation in two South American Nothofagus species (Nothofagaceae).
Puntieri JG, Souza MS, Brion C, Mazzini C, Barthelemy D. Puntieri JG, et al. Ann Bot. 2003 Oct;92(4):589-99. doi: 10.1093/aob/mcg175. Epub 2003 Aug 21. Ann Bot. 2003. PMID: 12933366 Free PMC article. - Preformation and distribution of staminate and pistillate flowers in growth units of Nothofagus alpina and N. obliqua (Nothofagaceae).
Puntieri JG, Grosfeld JE, Heuret P. Puntieri JG, et al. Ann Bot. 2009 Feb;103(3):411-21. doi: 10.1093/aob/mcn235. Epub 2008 Nov 25. Ann Bot. 2009. PMID: 19033286 Free PMC article. - Shoot development and extension of Quercus serrata saplings in response to insect damage and nutrient conditions.
Mizumachi E, Mori A, Osawa N, Akiyama R, Tokuchi N. Mizumachi E, et al. Ann Bot. 2006 Jul;98(1):219-26. doi: 10.1093/aob/mcl091. Epub 2006 May 18. Ann Bot. 2006. PMID: 16709576 Free PMC article.
References
- BellAD.1991. Plant form. An illustrated guide to flowering plant morphology. Oxford: Oxford University Press.
- BrunelN.2001. Étude du déterminisme de la préséance des bourgeons le long du rameau d’un an chez le pommier (Malus domestica (L.) Borkh.): approches morphologique, biochimique et moléculaire. PhD Thesis, University of Angers, France.
- Buck‐SorlinGH, Bell A.2000a Models of crown architecture in Quercus petraea and Q. robur: shoot lengths and bud numbers. Forestry 73: 1–19.
- Buck‐SorlinGH, Bell A.2000b Crown architecture in Quercus petraea and Q. robur, the fate of buds and shoots in relation to age, position and environmental perturbation. Forestry 73: 331–349.
- BurgeC, Karlin S.1997. Prediction of complete gene structures in human genomic DNA. Journal of Molecular Biology 268: 78–94. - PubMed


