Adaptor and clathrin exchange at the plasma membrane and trans-Golgi network - PubMed (original) (raw)
Adaptor and clathrin exchange at the plasma membrane and trans-Golgi network
Xufeng Wu et al. Mol Biol Cell. 2003 Feb.
Abstract
We previously demonstrated, using fluorescence recovery after photobleaching, that clathrin in clathrin-coated pits at the plasma membrane exchanges with free clathrin in the cytosol, suggesting that clathrin-coated pits are dynamic structures. We now investigated whether clathrin at the trans-Golgi network as well as the clathrin adaptors AP2 and AP1 in clathrin-coated pits at the plasma membrane and trans-Golgi network, respectively, also exchange with free proteins in the cytosol. We found that when the budding of clathrin-coated vesicle is blocked without significantly affecting the structure of clathrin-coated pits, both clathrin and AP2 at the plasma membrane and clathrin and AP1 at the trans-Golgi network exchange rapidly with free proteins in the cytosol. In contrast, when budding of clathrin-coated vesicles was blocked at the plasma membrane or trans-Golgi network by hypertonic sucrose or K(+) depletion, conditions that markedly affect the structure of clathrin-coated pits, clathrin exchange was blocked but AP2 at the plasma membrane and both AP1 and the GGA1 adaptor at the trans-Golgi network continue to rapidly exchange. We conclude that clathrin-coated pits are dynamic structures with rapid exchange of both clathrin and adaptors and that adaptors are able to exchange independently of clathrin when clathrin exchange is blocked.
Figures
Figure 1
Colocalization of clathrin and AP2 on the plasma membrane. Cells were imaged using CFP-clathrin and GFP-AP2 by using the 63× objective. (A) CFP-clathrin. (B) GFP-AP2. (C) Overlap between clathrin (red) and AP2 (green). The arrow points to an area of clustered pits. The insets show the distribution of clathrin, AP2, and overlap between clathrin and AP2. Bar, 9 μm.
Figure 2
Fluorescence recovery after photobleaching GFP-AP2 in HeLa cells at 37°C under different conditions. (A–C) Control HeLa cells. (D–F) HeLa depleted of cholesterol. (G–I) HeLa cells expressing K44A-dynamin. (A, D, and G) Images obtained directly before being photobleached. (B, E, and H) Images immediately after photobleaching. (C, F, and I) Images 2 min after photobleaching. The photobleached area is indicated in each figure. Bars, A–C, 6.5 μm; D–F; 9.5 μm; and G–I, 9 μm.
Figure 3
Kinetics of GFP-AP2 recovery after photobleaching at 37°C. HeLa control cells (triangles). HeLa cells depleted of cholesterol (circles). HeLa cells expressing K44A-dynamin (diamonds). Cells were photobleached at 10 s and then scanned at low laser power.
Figure 4
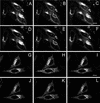
Fluorescence recover after photobleaching of CFP-clathrin and GFP-AP1 at the _trans_-Golgi network at 37 and 20°C. HeLa cells at 37°C (A–F) and 20°C (G–L) were imaged for CFP-clathrin (A–C and G–I) and GFP-AP1 (D–F and J–L) before photobleaching (A, D, G, and J), immediately after photobleaching (B, E, H, and K), and either 2 min (C and F) or 5 min (I and L) after photobleaching. The photobleached area is indicated in each figure. Bars, A–F, 11 μm; G–L, 13 μm.
Figure 5
Kinetics of recovery after photobleaching of CFP-clathrin and GFP-AP1 at the TGN at 37°C (closed symbols) and 20°C (open symbols). Time course of recovery are shown for GFP-clathrin (circles) and GFP-AP1 (triangles).
Figure 6
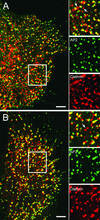
Colocalization of CFP-clathrin and GFP-AP2 in cells treated with hypertonic sucrose or depleted of K+. HeLa cells were treated as described in MATERIALS OF METHODS to block clathrin exchange at the coated pits. HeLa cells were then imaged at 63× to examine clathrin and AP2 in K+-depleted cells (A) or cells treated with hypertonic sucrose (B). The inset shows the distribution of clathrin, AP2, and overlap between clathrin and AP2. The arrows point to the clathrin clusters. Bar, 5 μm.
Figure 7
Fluorescence recovery after photobleaching GFP-AP2 in HeLa cells in cells depleted of K+ (B–D) or treated with hypertonic sucrose (F–H) at 37°C. (A and E) Image of CFP-clathrin and GFP-AP2 in treated HeLa cells. (B and F) AP2 image obtained directly before being photobleached. (C and G) Image immediately after photobleaching. (D and H) Image 2 min after photobleaching. The photobleached area is indicated in each figure. Bars, 5 μm.
Figure 8
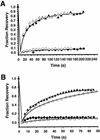
Time course of fluorescence recovery after photobleaching of adaptors and clathrin in cells depleted of K+ (open symbols) or treated with hypertonic sucrose at 37°C filled symbols) (A) Time course of recovery of GFP-AP2 (triangles) and GFP-clathrin (circles) at the plasma membrane. (B) Time course of recovery of GFP-AP1 (triangles) and GFP-clathrin (circles) at the TGN.
Figure 9
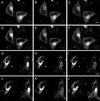
Fluorescence recovery after photobleaching of CFP-clathrin and GFP-AP1 at the _trans_-Golgi network of cells depleted of K+ or treated with hypertonic sucrose at 37°C. HeLa cells were imaged for CFP-clathrin (A–C and G–I) and GFP-AP1 (D–F and J–L) before photobleaching (A, D, G, and J), immediately after photobleaching (B, E, H, K), and 2 min (C, F, I, L) after photobleaching in cells K+ depleted (A–F) or treated with hypertonic sucrose (G–L). The photobleached area is indicated in each figure. Bar, A–F, 7.5 μm; G–L, 5.5 μm.
Figure 10
Fluorescence recovery after photobleaching of GFP-GGA1 at the TGN of cells under different conditions at 37°C. HeLa cells were imaged for GFP-GGA1 before photobleaching (A, D, and G), immediately after photobleaching (B, E, and H), and 2 min (C, F, and I) after photobleaching in control cells (A–C), in cells K+ depleted (D–F) or treated with hypertonic sucrose (G–I). The photobleached area is indicated in each figure. Bar, 12 μm.
Similar articles
- Morphology and dynamics of clathrin/GGA1-coated carriers budding from the trans-Golgi network.
Puertollano R, van der Wel NN, Greene LE, Eisenberg E, Peters PJ, Bonifacino JS. Puertollano R, et al. Mol Biol Cell. 2003 Apr;14(4):1545-57. doi: 10.1091/mbc.02-07-0109. Mol Biol Cell. 2003. PMID: 12686608 Free PMC article. - Clathrin and HA2 adaptors: effects of potassium depletion, hypertonic medium, and cytosol acidification.
Hansen SH, Sandvig K, van Deurs B. Hansen SH, et al. J Cell Biol. 1993 Apr;121(1):61-72. doi: 10.1083/jcb.121.1.61. J Cell Biol. 1993. PMID: 8458873 Free PMC article. - Clathrin exchange during clathrin-mediated endocytosis.
Wu X, Zhao X, Baylor L, Kaushal S, Eisenberg E, Greene LE. Wu X, et al. J Cell Biol. 2001 Oct 15;155(2):291-300. doi: 10.1083/jcb.200104085. Epub 2001 Oct 15. J Cell Biol. 2001. PMID: 11604424 Free PMC article. - Conformational regulation of AP1 and AP2 clathrin adaptor complexes.
Beacham GM, Partlow EA, Hollopeter G. Beacham GM, et al. Traffic. 2019 Oct;20(10):741-751. doi: 10.1111/tra.12677. Epub 2019 Aug 6. Traffic. 2019. PMID: 31313456 Free PMC article. Review. - Adaptors for clathrin-mediated traffic.
Kirchhausen T. Kirchhausen T. Annu Rev Cell Dev Biol. 1999;15:705-32. doi: 10.1146/annurev.cellbio.15.1.705. Annu Rev Cell Dev Biol. 1999. PMID: 10611976 Review.
Cited by
- Lowe syndrome protein OCRL1 interacts with clathrin and regulates protein trafficking between endosomes and the trans-Golgi network.
Choudhury R, Diao A, Zhang F, Eisenberg E, Saint-Pol A, Williams C, Konstantakopoulos A, Lucocq J, Johannes L, Rabouille C, Greene LE, Lowe M. Choudhury R, et al. Mol Biol Cell. 2005 Aug;16(8):3467-79. doi: 10.1091/mbc.e05-02-0120. Epub 2005 May 25. Mol Biol Cell. 2005. PMID: 15917292 Free PMC article. - The Reelin receptor ApoER2 is a cargo for the adaptor protein complex AP-4: Implications for Hereditary Spastic Paraplegia.
Caracci MO, Pizarro H, Alarcón-Godoy C, Fuentealba LM, Farfán P, De Pace R, Santibañez N, Cavieres VA, Pástor TP, Bonifacino JS, Mardones GA, Marzolo MP. Caracci MO, et al. Prog Neurobiol. 2024 Mar;234:102575. doi: 10.1016/j.pneurobio.2024.102575. Epub 2024 Jan 26. Prog Neurobiol. 2024. PMID: 38281682 - Two di-leucine motifs regulate trafficking of mucolipin-1 to lysosomes.
Vergarajauregui S, Puertollano R. Vergarajauregui S, et al. Traffic. 2006 Mar;7(3):337-53. doi: 10.1111/j.1600-0854.2006.00387.x. Traffic. 2006. PMID: 16497227 Free PMC article. - Evolving nature of the AP2 alpha-appendage hub during clathrin-coated vesicle endocytosis.
Praefcke GJ, Ford MG, Schmid EM, Olesen LE, Gallop JL, Peak-Chew SY, Vallis Y, Babu MM, Mills IG, McMahon HT. Praefcke GJ, et al. EMBO J. 2004 Nov 10;23(22):4371-83. doi: 10.1038/sj.emboj.7600445. Epub 2004 Oct 21. EMBO J. 2004. PMID: 15496985 Free PMC article. - Clathrin couture: fashioning distinctive membrane coats at the cell surface.
Traub LM. Traub LM. PLoS Biol. 2009 Sep;7(9):e1000192. doi: 10.1371/journal.pbio.1000192. Epub 2009 Sep 8. PLoS Biol. 2009. PMID: 19809570 Free PMC article. No abstract available.
References
- Beck KA, Keen JH. Interaction of phosphoinositide cycle intermediates with the plasma membrane-associated clathrin assembly protein AP-2. J Biol Chem. 1991;266:4442–4447. - PubMed
- Brodin L, Low P, Shupliakov O. Sequential steps in clathrin-mediated synaptic vesicle endocytosis. Curr Opin Neurobiol. 2000;10:312–320. - PubMed
- Brown CM, Roth MG, Henis YI, Petersen NO. An internalization-competent influenza hemagglutinin mutant causes the redistribution of AP-2 to existing coated pits and is colocalized with AP-2 in clathrin free clusters. Biochemistry. 1999;38:15166–15173. - PubMed
- Collins BM, McCoy AJ, Kent HM, Evans PR, Owen DJ. Molecular architecture, and functional model of the endocytic AP2 complex. Cell. 2002;109:523–535. - PubMed
MeSH terms
Substances
LinkOut - more resources
Full Text Sources
Research Materials


