Nitric oxide partially controls Coxiella burnetii phase II infection in mouse primary macrophages - PubMed (original) (raw)
Nitric oxide partially controls Coxiella burnetii phase II infection in mouse primary macrophages
Dario S Zamboni et al. Infect Immun. 2003 Mar.
Abstract
In most primary or continuous cell cultures infected with the Q-fever agent Coxiella burnetii, bacteria are typically sheltered in phagolysosome-like, large replicative vacuoles (LRVs). We recently reported that only a small proportion of mouse peritoneal macrophages (PMPhi) infected with a nonvirulent, phase II strain of C. burnetii developed LRVs and that their relative bacterial load increased only slowly. In the majority of infected PMPhi, the bacteria were confined to the small vesicles. We show here that nitric oxide (NO) induced by the bacteria partially accounts for the restricted development of LRVs in primary macrophages. Thus, (i) PMPhi and bone marrow-derived macrophages (BMMPhi) challenged with phase II C. burnetii produced significant amounts of NO; (ii) the NO synthase inhibitors aminoguanidine and N-methyl-L-arginine reduced the production of NO and increased the frequency of LRVs (although the relative bacterial loads of individual LRVs did not change, the estimated loads per well increased appreciably); (iii) gamma interferon (IFN-gamma) or the NO donor sodium nitroprusside, added to BMMPhi prior to or after infection, reduced the development and the relative bacterial loads of LRVs and lowered the yield of viable bacteria recovered from the cultures; and (iv) these effects of IFN-gamma may not be entirely dependent on the production of NO since IFN-gamma also controlled the infection in macrophages from inducible NO synthase knockout mice. It remains to be determined whether NO reduced the development of LRVs by acting directly on the bacteria; by acting on the traffic, fusion, or fission of cell vesicles; or by a combination of these mechanisms.
Figures
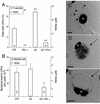
FIG. 1.
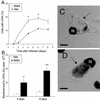
Contrasting features of C. burnetii phase II infection of mouse PMΦ and BMMΦ. Parallel cultures of macrophages were infected for 24 h with C. burnetii phase II; at different times, the cultures were fixed and processed as described in Materials and Methods. (A) Percentage of cells with LRVs as a function of the duration of infection. Symbols: •, PMΦ; ○, BMMΦ. (B) Relative bacterial load in LRVs on days 4 and 6 after infection. Bars: □, PMΦ; ▪, BMMΦ. Data represent the mean ± the standard deviation of one representative experiment out of five with similar results. Asterisks indicate statistically significant differences between PMΦ and BMMΦ (✽, P < 0.05; ✽✽, P < 0.01). (C and D) Superimposed confocal images of DAPI fluorescence (black) and Nomarski differential interference contrast (gray) of a representative PMΦ (C) and BMMΦ (D). The arrow points to large vacuole. N, cell nuclei. Bar, 10 μm.
FIG. 2.
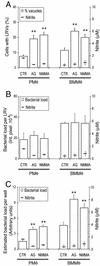
Effect of AG or NMMA on the infection of PMΦ or BMMΦ by C. burnetii phase II bacteria. Cultures were infected for 24 h, washed, and kept in AG- or NMMA-containing medium for the 6 days of the infection. (A) Percentage of cells with LRVs and nitrite production by control and AG- or NMMA-treated PMΦ and BMMΦ cultures. (B) Average of the relative bacterial load per LRV. (C) Fluorimetrically estimated total bacterial load per well in the same exper-iment shown in panels A and B. For clarity, the same nitrite data are shown in panels A, B, and C. Means ± the standard deviations of one representative experiment from three with similar results. Asterisks indicate that differences between control (CTR) and treated cultures (AG or NMMA) were statistically significant (P < 0.01).
FIG. 3.
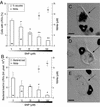
Effect of SNP on the frequency of LRVs and their bacterial load in C. burnetii phase II-infected BMMΦ. SNP was added to the cultures at the time of infection and was kept in the medium until the end of experiment (6 days). The percentages of cells with LRVs (A) and the relative bacterial loads in the LRVs (B) are shown, together with the production of nitrite, as a function of the SNP concentration. The same nitrite data are shown in panels A and B as the means ± the standard deviations of one representative experiment from three with similar results. Significant differences between untreated control and treated cultures are indicated (✽, P < 0.05; ✽✽, P < 0.01). (C to E) Confocal superimposed images of DAPI fluorescence (black) and Nomarski differential interference contrast (gray). Images of representative cells illustrate the difference in bacterial loads inside the large vacuoles (arrow) of cells that were either left untreated (C) or were treated with 50 μM (D) or 100 μM (E) SNP. N, cell nuclei. Bar, 10 μm.
FIG. 4.
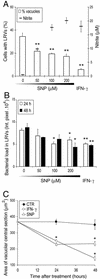
Effect of SNP or IFN-γ on established infection of BMMΦ. At 4 days after C. burnetii infection, cultures were treated with SNP or IFN-γ. After 24 or 48 h, supernatants were removed for nitrite determination, and cells were processed as described in Materials and Methods. (A) Percentage of cells with LRVs and nitrite in culturesupernatants as a function of SNP concentration or IFN-γ treatment for 48 h. (B) Relative bacterial loads in LRVs of macrophages treated with SNP or IFN-γ for 24 (gray bars) or 48 h (black bars). (C) Vacuolar central optical section areas in cells treated with 100 μM SNP (▵), 50 ng of IFN-γ/ml (○), or controls (•) as a function of time. Results are expressed as the means ± standard deviations of one of two experiments. Significant differences between untreated control and treated cultures are indicated (✽, P < 0.05; ✽✽, P < 0.01)
FIG. 5.
Effect of IFN-γ, AG, or both on the infection of BMMΦ with C. burnetii phase II. IFN-γ, AG, or both were added to the cultures, together with the bacteria, for 24 h. At that time cells were washed and kept in fresh drug-containing medium. At 6 days after infection, supernatants were collected for nitrite determination and cells processed as described in Materials and Methods. (A) Percentage of cells with LRVs and nitrite concentration in the same cultures. (B) Relative bacterial load in LRVs and the same nitrite concentration data shown in panel A on a different scale. Results are presented as the mean ± the standard deviation of one representative experiment from three experiments with similar results. Statistically significant differences between untreated control (CTR) and treated cultures are indicated (✽, P < 0.05; ✽✽, P < 0.01). (C to E) Confocal superimposed images of DAPI fluorescence (black) and Nomarski differential interference contrast (gray). The images show cells from cultures treated with IFN-γ (C), AG (D), or AG plus IFN-γ (E). The arrowheads indicate C. burnetii dispersed through the cytoplasm; the arrows indicate the large vacuole. N, cell nucleus. Bar, 10 μm.
FIG. 6.
Effect of IFN-γ, AG, or both, on C. burnetii viability in BMMΦ. IFN-γ, AG, or both were added to the cultures, together with the bacteria, for 24 h. At that time the cells were washed and kept in fresh drug-containing medium. At 6 days after infection, supernatants were collected for nitrite determination and the bacterial viability was determined as described in Materials and Methods. (A) Macrophages obtained from WT mice; (B) macrophages obtained from iNOS KO mice. The results are given as the relative infection index (FFU) as the means ± the standard errors of one representative experiment from two with similar results.
Similar articles
- Phagocytosis of apoptotic cells increases the susceptibility of macrophages to infection with Coxiella burnetii phase II through down-modulation of nitric oxide production.
Zamboni DS, Rabinovitch M. Zamboni DS, et al. Infect Immun. 2004 Apr;72(4):2075-80. doi: 10.1128/IAI.72.4.2075-2080.2004. Infect Immun. 2004. PMID: 15039329 Free PMC article. - Both inducible nitric oxide synthase and NADPH oxidase contribute to the control of virulent phase I Coxiella burnetii infections.
Brennan RE, Russell K, Zhang G, Samuel JE. Brennan RE, et al. Infect Immun. 2004 Nov;72(11):6666-75. doi: 10.1128/IAI.72.11.6666-6675.2004. Infect Immun. 2004. PMID: 15501800 Free PMC article. - Coxiella burnetii as a useful tool to investigate bacteria-friendly host cell compartments.
Pechstein J, Schulze-Luehrmann J, Lührmann A. Pechstein J, et al. Int J Med Microbiol. 2018 Jan;308(1):77-83. doi: 10.1016/j.ijmm.2017.09.010. Epub 2017 Sep 14. Int J Med Microbiol. 2018. PMID: 28935173 Review. - Q fever: persistence of antigenic non-viable cell residues of Coxiella burnetii in the host--implications for post Q fever infection fatigue syndrome and other chronic sequelae.
Marmion BP, Sukocheva O, Storm PA, Lockhart M, Turra M, Kok T, Ayres J, Routledge H, Graves S. Marmion BP, et al. QJM. 2009 Oct;102(10):673-84. doi: 10.1093/qjmed/hcp077. Epub 2009 Jun 25. QJM. 2009. PMID: 19556396 Review.
Cited by
- Immunological cell type characterization and Th1-Th17 cytokine production in a mouse model of Gaucher disease.
Pandey MK, Rani R, Zhang W, Setchell K, Grabowski GA. Pandey MK, et al. Mol Genet Metab. 2012 Jul;106(3):310-22. doi: 10.1016/j.ymgme.2012.04.020. Epub 2012 Apr 30. Mol Genet Metab. 2012. PMID: 22595426 Free PMC article. - Molecular pathogenesis of the obligate intracellular bacterium Coxiella burnetii.
van Schaik EJ, Chen C, Mertens K, Weber MM, Samuel JE. van Schaik EJ, et al. Nat Rev Microbiol. 2013 Aug;11(8):561-73. doi: 10.1038/nrmicro3049. Epub 2013 Jun 24. Nat Rev Microbiol. 2013. PMID: 23797173 Free PMC article. Review. - Stress Induces Release of Extracellular Vesicles by Trypanosoma cruzi Trypomastigotes.
Vasconcelos CI, Cronemberger-Andrade A, Souza-Melo N, Maricato JT, Xander P, Batista WL, Soares RP, Schenkman S, Torrecilhas AC. Vasconcelos CI, et al. J Immunol Res. 2021 Sep 23;2021:2939693. doi: 10.1155/2021/2939693. eCollection 2021. J Immunol Res. 2021. PMID: 34604391 Free PMC article. - Isolation, typing, and drug susceptibility of Leishmania (Leishmania) infantum isolates from dogs of the municipality of Embu das Artes, an endemic region for canine leishmaniasis in Brazil.
Ferreira BA, Martins TFC, Coser EM, da L Oliveira V, Yamashiro-Kanashiro EH, Rocha MC, Pinto MM, Cotrim PC, Coelho AC. Ferreira BA, et al. Parasitol Res. 2022 Sep;121(9):2683-2695. doi: 10.1007/s00436-022-07594-5. Epub 2022 Jul 8. Parasitol Res. 2022. PMID: 35802163 - Isolation of Skin Leukocytes Uncovers Phagocyte Inflammatory Responses During Induction and Resolution of Cutaneous Inflammation in Fish.
Soliman AM, Yoon T, Wang J, Stafford JL, Barreda DR. Soliman AM, et al. Front Immunol. 2021 Sep 24;12:725063. doi: 10.3389/fimmu.2021.725063. eCollection 2021. Front Immunol. 2021. PMID: 34630399 Free PMC article.
References
- Baca, O. G., Y. P. Li, and H. Kumar. 1994. Survival of the Q fever agent Coxiella burnetii in the phagolysosome. Trends Microbiol. 2:476-480. - PubMed
Publication types
MeSH terms
Substances
LinkOut - more resources
Full Text Sources
