Spatiotemporal dynamics of sensory responses in layer 2/3 of rat barrel cortex measured in vivo by voltage-sensitive dye imaging combined with whole-cell voltage recordings and neuron reconstructions - PubMed (original) (raw)
Spatiotemporal dynamics of sensory responses in layer 2/3 of rat barrel cortex measured in vivo by voltage-sensitive dye imaging combined with whole-cell voltage recordings and neuron reconstructions
Carl C H Petersen et al. J Neurosci. 2003.
Erratum in
- J Neurosci. 2004 Oct 6;24(40):1 p following 906
Abstract
The spatiotemporal dynamics of the sensory response in layer 2/3 of primary somatosensory cortex evoked by a single brief whisker deflection was investigated by simultaneous voltage-sensitive dye (VSD) imaging and whole-cell (WC) voltage recordings in the anesthetized rat combined with reconstructions of dendritic and axonal arbors of L2/3 pyramids. Single and dual WC recordings from pyramidal cells indicated a strong correlation between the local VSD population response and the simultaneously measured subthreshold postsynaptic potential changes in both amplitude and time course. The earliest VSD response was detected 10-12 msec after whisker deflection centered above the barrel isomorphic to the stimulated principal whisker. It was restricted horizontally to the size of a single barrel-column coextensive with the dendritic arbor of barrel-column-related pyramids in L2/3. The horizontal spread of excitation remained confined to a single barrel-column with weak whisker deflection. With intermediate deflections, excitation spread into adjacent barrel-columns, propagating twofold more rapidly along the rows of the barrel field than across the arcs, consistent with the preferred axonal arborizations in L2/3 of reconstructed pyramidal neurons. Finally, larger whisker deflections evoked excitation spreading over the entire barrel field within approximately 50 msec before subsiding over the next approximately 250 msec. Thus the subthreshold cortical map representing a whisker deflection is dynamic on the millisecond time scale and strongly depends on stimulus strength. The sequential spatiotemporal activation of the excitatory neuronal network in L2/3 by a simple sensory stimulus can thus be accounted for primarily by the columnar restriction of L4 to L2/3 excitatory connections and the axonal field of barrel-related pyramids.
Figures
Fig. 1.
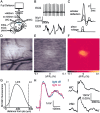
Simultaneous whole-cell and voltage-sensitive dye recording in vivo. A, The medial portion of the posterior somatosensory barrel cortex was stained with voltage-sensitive dye RH1691. The VSD signal was imaged with a Fuji Deltaron camera simultaneously with single or dual whole-cell recordings. B, The animal was continually monitored by ECG and EEG measurements. ECG measurements are of importance because the largest imaging artifacts are caused by heart beat-related pulsation. By triggering image acquisition relative to a known phase of the ECG, such artifacts can be subtracted.C, Whiskers were deflected by a piezo under computer control. High-speed filming allowed the quantification of whisker deflections evoked at three different stimulation strengths used in this study. D, The blood vessel pattern is imaged in the experimental setup (just before VSD imaging) under green illumination (535 nm) with the Fuji Deltaron camera. The pattern of these blood vessels is subsequently used for targeting whole-cell recordings within the functional map of barrel cortex derived from the voltage-sensitive dye imaging. Scale bar, 500 μm. E, A single frame of the imaged VSD signal collected 14.4 msec after a 2 msec single whisker deflection. The raw data from the camera have been normalized to the prestimulus fluorescence (Δ_F_/F_0). The_gray scale ranges from a −0.1% (black) to 0.1% (white) fractional change, with no response giving a gray pixel. F, The same VSD image as before but now shown on the _yellow_-hot color scale after Gaussian filtering (radius of 75 μm). Image smoothing was used exclusively for clarity of image presentation. All quantitative analyses of the VSD signals were performed on the original data set.G, Depth penetration of RH1691 measured in coronal brain slices. H, Photodynamic damage appeared negligible under our experimental conditions. The response amplitude and kinetics were unchanged within the noise limits in this averaged series of 100 sweeps for each condition with excitation light alternately on or off.I, Average of 10 sweeps showing the change in membrane potential of a layer 2/3 pyramidal neuron (WC) evoked by the whisker deflection compared with the simultaneously recorded voltage-sensitive dye signal (VSD) quantified from a 200 × 200 μm region of interest around the neuron.
Fig. 2.
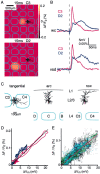
Subthreshold membrane potential changes in layer 2/3 pyramidal neurons are closely correlated with the local voltage-sensitive dye signal. A, The voltage-sensitive dye image of the cortical evoked response recorded 15 msec after deflection of the C3 whisker (top panel) and the D2 whisker (bottom panel). Superimposed are the reconstructed dendrites of the layer 2/3 pyramidal neuron from which a whole-cell recording was made simultaneously with the voltage-sensitive dye imaging. The neuron is located between the C3 and C4 barrels (barrel field with arcs oriented vertically and rows oriented horizontally. The barrels on the left edge belong to arc 1). B, The membrane potential changes evoked by stimulation of the C3 (red) and D2 (blue) whisker recorded in the layer 2/3 pyramidal neuron (top traces). The voltage-sensitive dye signal from a 200 × 200 μm region around the soma of the neuron is quantified (bottom traces). The membrane potential changes of a single neuron appear to be closely correlated with the voltage-sensitive dye signal in time course and relative amplitude, which presumably results from many neurons. C, Three different projections of the three-dimensional reconstruction of the dendritic arbor of the layer 2/3 pyramidal neuron shown in_A_. D, For the same neuron the VSD signal is plotted as a function of change in membrane potential during the first 200 msec of the whisker response. The two measurements are correlated linearly for the response to both the C3 whisker deflection (red) and the D2 deflection (blue) with a similar calibration constant. The depolarization in membrane potential of a single neuron appears to be closely correlated with the VSD signal in time course and relative amplitude, which obviously originate from many neurons. E, The normalized local VSD signal amplitude plotted as a function of the change in membrane potential across all neurons in the experimental data set. The_black_ data points indicate data collected under 1.5–2 gm/kg urethane anesthesia (n = 24), the_green_ data points are from experiments using animals that were more lightly anesthetized with 1–1.5 gm/kg urethane (n = 5), and the cyan data points are from experiments conducted under halothane (0.5–1%) anesthesia (n = 3). Under all of these conditions of different levels of anesthesia there is a close correlation between membrane potential changes and VSD signal.
Fig. 3.
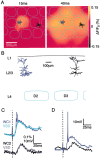
Dual whole-cell recordings from neurons in different cortical columns correlate closely with their respective local voltage-sensitive dye signal. A, The early VSD dye signal is localized close to one of the layer 2/3 pyramidal neurons (dendrites colored blue). At longer latencies the VSD signal indicates depolarization of a larger cortical region, including the location of the other whole-cell recording (dendrites in_black_). B, Normal view of the cortex along a row to indicate the separation of the dendritic arbors of the two layer 2/3 pyramidal neurons that were recorded. C, The local VSD signal (gray for the_black_ neuron and cyan for the_blue_ neuron) around each neuron follows closely the subthreshold membrane potential of the respective neurons. The latency, amplitude, and kinetics of the VSD signal and the membrane potential changes are well matched for both neurons. The early deviation in the WC recording from the blue neuron is caused by action potentials, which in general are not well correlated with a VSD signal (single sweep of the membrane potentials shown in D). The VSD signal is scaled identically for the two locations, indicating that the VSD image can be calibrated linearly and used to predict the membrane potential changes across the field of view under these experimental conditions.
Fig. 4.
Three-dimensional reconstruction of the dendritic and axonal arbors of a layer 2/3 pyramidal neuron. During in vivo whole-cell recordings of layer 2/3 pyramidal neurons simultaneous with VSD imaging, the neuron is filled with biocytin. Subsequent staining of fixed tangential slices reveals the axonal and dendritic structure, which can be traced in three dimensions with the aid of a computer. The barrel field is visualized by cytochrome_c_ staining. The axon extends into all neighboring barrel-columns, whereas the dendrites remain close to the soma. The axon extends farther along the row than along the arc.
Fig. 5.
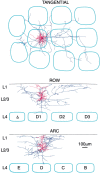
Axonal arbors of layer 2/3 pyramidal neurons are preferentially oriented along rows. A, The superimposed reconstructions of 5 axons (blue) and 10 dendrites (red) from layer 2/3 pyramidal neurons in a tangential projection plotted on an idealized barrel field composed of 400 × 400 μm barrels separated by 100 μm of septa (left panel). The density of neuronal processes was calculated and Gaussian smoothed (50 μm smoothing). Contours of 10 and 50% density of axon (blue) and dendrite (red) plotted on the idealized barrel field (right panel). Dendritic field span is rather limited compared with the axon. The extent of the axon is clearly longer along the row as compared with the arc. B, The laminar extent of the reconstructed dendrites and axons along the rows of the barrel field. Axonal arbors were reconstructed only within layer 2/3.C, The laminar extent of the reconstructed dendrites and axons along the arcs of the barrel field.
Fig. 6.
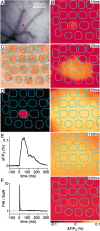
Spatiotemporal dynamics of the layer 2/3 neocortical voltage-sensitive dye response to a single brief whisker stimulus compared with the barrel map of layer 4. A, The blood vessels at the cortical surface are shown (top left) with a red dot indicating the location of a superficial DiI injection. The DiI was injected into the cortical location of the epicenter of the voltage-sensitive dye response evoked by a brief deflection of the D2 whisker. B, The spatiotemporal dynamics of the sensory response indicate a localized initial response at 10 msec after the stimulus, which rapidly spreads to excite the entire posterior medial barrel cortex at 50 msec, before decaying over the next 100 msec. C, The brain was fixed and kept at 35°C for 2 weeks to allow DiI diffusion in membranes. Subsequently the brain was sliced tangentially allowing the layer 4 barrels to be visualized under bright-field illumination. The barrels are outlined in cyan. D, DiI fluorescence was analyzed in the same slice. The fluorescence is limited primarily to the D2 barrel. The epicenter of the electrical sensory response to deflection of the D2 whisker thus occurs in the isomorphic cortical column defined by the D2 barrel. E, The time course of the VSD signal in the D2 barrel-column is plotted. F, The ratio of the response amplitude observed in the D2 barrel-column [principal whisker (PW)] compared with the response in surrounding barrel-columns [surround whisker (SuW)] is plotted. The_sharp peak_ indicates that for a short period of a few milliseconds the evoked response is localized to the D2 barrel-column and that the response rapidly becomes rather homogeneous at the spatial level of neighboring barrel-columns.
Fig. 7.
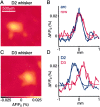
The earliest detectable response in layer 2/3 has tangential dimensions similar to a barrel-column. A, Brief deflection of the D2 whisker evoked a cortical response imaged 9.6 msec later that had lateral dimensions quantified along the row and arc were similar to a barrel-column. B, The spatial extent of this early VSD signal was quantified by fitting Gaussian curves to the VSD signal profile along the row (red trace; FWHM = 435 μm) or along the arc (blue trace; FWHM = 390 μm). C, Deflection of the D3 whisker evoked a response in a different cortical location imaged at 9.6 msec. Again the lateral extent of this early signal had dimensions comparable with that of a layer 4 barrel (row FWHM = 400 μm; arc FWHM = 320 μm) D, The VSD profile from these early images quantified along the row for the D2 response (blue trace) and the D3 response (red trace). The peaks of the two curves are clearly distinct and are separated by 420 μm.
Fig. 8.
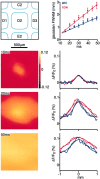
Excitation spreads preferentially along rows compared with arcs. The left column shows a series of voltage-sensitive dye images demonstrating the time-dependent spread of excitation, along with a schematic drawing of the orientation of the barrel field (top). The earliest response (10 msec) has no preferred orientation, with a small signal amplitude that is confined horizontally to a single barrel-column. Subsequently (images at 20 and 50 msec), excitation extends into neighboring barrel-columns with a preferential spread along the rows of barrel cortex. The_right column_ provides quantification of the spread of excitation. Gaussian functions are fitted to line sections of the voltage-sensitive dye response oriented along the row (red curves) or arc (blue curves) through the epicenter. The broader Gaussian curves calculated along the row indicated the preferred orientation of the delayed spread of excitation. The propagation velocity of the Gaussian wave front is twice as fast along the row compared with along the arc (top).
Fig. 9.
The spread of excitation decreases at small whisker deflection, and at very weak stimulation intensities excitation remains confined to a single barrel-column. A, Strong whisker deflection (6° amplitude evoked with high velocity and acceleration) evoked a response confined initially to a barrel-column that spread rapidly to comprise the entire barrel cortex. Scale bar, 200 μm. B, At reduced whisker deflection (2° amplitude evoked with lower velocity and acceleration) the response was smaller in amplitude and spread over a smaller area but preferentially along the rows. C, Weak whisker stimulation (0.6° amplitude evoked with still lower velocity and acceleration) evoked a small amplitude response of brief duration, which remained confined to the barrel-column. A schematic drawing of the local barrel field map is superimposed (left). D, In addition to spreading over a larger cortical area, the time course of sensory responses increased with stimulation strength (red curve, 0.6° stimulus; blue curve, 2° stimulus; black curve, 6° stimulus). E, The spatial extent of the VSD signal evoked by the weakest stimulus (0.6°) is quantified for three time points to show that the VSD signal does not spread (blue, 12 msec;red, 16.8 msec; black, 24 msec). Thus a functional neocortical column has been directly visualized in vivo, in response to a sensory input, for the first time.
Similar articles
- Dynamic receptive fields of reconstructed pyramidal cells in layers 3 and 2 of rat somatosensory barrel cortex.
Brecht M, Roth A, Sakmann B. Brecht M, et al. J Physiol. 2003 Nov 15;553(Pt 1):243-65. doi: 10.1113/jphysiol.2003.044222. Epub 2003 Aug 29. J Physiol. 2003. PMID: 12949232 Free PMC article. - Sub- and suprathreshold receptive field properties of pyramidal neurones in layers 5A and 5B of rat somatosensory barrel cortex.
Manns ID, Sakmann B, Brecht M. Manns ID, et al. J Physiol. 2004 Apr 15;556(Pt 2):601-22. doi: 10.1113/jphysiol.2003.053132. Epub 2004 Jan 14. J Physiol. 2004. PMID: 14724202 Free PMC article. - Mapping functional connectivity in barrel-related columns reveals layer- and cell type-specific microcircuits.
Schubert D, Kötter R, Staiger JF. Schubert D, et al. Brain Struct Funct. 2007 Sep;212(2):107-19. doi: 10.1007/s00429-007-0147-z. Epub 2007 Jun 26. Brain Struct Funct. 2007. PMID: 17717691 Review. - Excitatory signal flow and connectivity in a cortical column: focus on barrel cortex.
Lübke J, Feldmeyer D. Lübke J, et al. Brain Struct Funct. 2007 Jul;212(1):3-17. doi: 10.1007/s00429-007-0144-2. Epub 2007 Jun 1. Brain Struct Funct. 2007. PMID: 17717695 Review.
Cited by
- Columnar interactions determine horizontal propagation of recurrent network activity in neocortex.
Wester JC, Contreras D. Wester JC, et al. J Neurosci. 2012 Apr 18;32(16):5454-71. doi: 10.1523/JNEUROSCI.5006-11.2012. J Neurosci. 2012. PMID: 22514308 Free PMC article. - Visible rodent brain-wide networks at single-neuron resolution.
Yuan J, Gong H, Li A, Li X, Chen S, Zeng S, Luo Q. Yuan J, et al. Front Neuroanat. 2015 May 28;9:70. doi: 10.3389/fnana.2015.00070. eCollection 2015. Front Neuroanat. 2015. PMID: 26074784 Free PMC article. Review. - Assessing the performance of Granger-Geweke causality: Benchmark dataset and simulation framework.
Pagnotta MF, Dhamala M, Plomp G. Pagnotta MF, et al. Data Brief. 2018 Oct 16;21:833-851. doi: 10.1016/j.dib.2018.10.034. eCollection 2018 Dec. Data Brief. 2018. PMID: 30417043 Free PMC article. - Lateral competition for cortical space by layer-specific horizontal circuits.
Adesnik H, Scanziani M. Adesnik H, et al. Nature. 2010 Apr 22;464(7292):1155-60. doi: 10.1038/nature08935. Nature. 2010. PMID: 20414303 Free PMC article. - Spatial organization of neuronal population responses in layer 2/3 of rat barrel cortex.
Kerr JN, de Kock CP, Greenberg DS, Bruno RM, Sakmann B, Helmchen F. Kerr JN, et al. J Neurosci. 2007 Nov 28;27(48):13316-28. doi: 10.1523/JNEUROSCI.2210-07.2007. J Neurosci. 2007. PMID: 18045926 Free PMC article.
References
- Agmon A, Connors BW. Thalamocortical responses of mouse somatosensory (barrel) cortex in vitro. Neuroscience. 1991;41:365–379. - PubMed
- Arieli A, Shoham D, Hildesheim R, Grinvald A. Coherent spatiotemporal pattern of on-going activity revealed by real-time optical imaging coupled with single unit recording in the cat visual cortex. J Neurophysiol. 1995;73:2072–2093. - PubMed
- Armstrong-James M, Fox K, Das-Gupta A. Flow of excitation within rat barrel cortex on striking a single vibrissa. J Neurophysiol. 1992;68:1345–1358. - PubMed
- Bernardo KL, McCasland JS, Woolsey TA, Strominger RN. Local intra- and interlaminar connections in mouse barrel cortex. J Comp Neurol. 1990;291:231–255. - PubMed
Publication types
MeSH terms
Substances
LinkOut - more resources
Full Text Sources
Other Literature Sources
