Autonomous T cell trafficking examined in vivo with intravital two-photon microscopy - PubMed (original) (raw)
Autonomous T cell trafficking examined in vivo with intravital two-photon microscopy
Mark J Miller et al. Proc Natl Acad Sci U S A. 2003.
Abstract
The recirculation of T cells between the blood and secondary lymphoid organs requires that T cells are motile and sensitive to tissue-specific signals. T cell motility has been studied in vitro, but the migratory behavior of individual T cells in vivo has remained enigmatic. Here, using intravital two-photon laser microscopy, we imaged the locomotion and trafficking of naive CD4(+) T cells in the inguinal lymph nodes of anesthetized mice. Intravital recordings deep within the lymph node showed T cells flowing rapidly in the microvasculature and captured individual homing events. Within the diffuse cortex, T cells displayed robust motility with an average velocity of approximately 11 microm x min(-1). T cells cycled between states of low and high motility roughly every 2 min, achieving peak velocities >25 microm x min(-1). An analysis of T cell migration in 3D space revealed a default trafficking program analogous to a random walk. Our results show that naive T cells do not migrate collectively, as they might under the direction of pervasive chemokine gradients. Instead, they appear to migrate as autonomous agents, each cell taking an independent trafficking path. Our results call into question the role of chemokine gradients for basal T cell trafficking within T cell areas and suggest that antigen detection may result from a stochastic process through which a random walk facilitates contact with antigen-presenting dendritic cells.
Figures
Figure 1
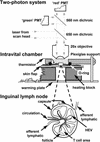
Intravital 2P imaging system. (Top and Middle) Schematic diagram of the 2P microscope and intravital imaging chamber. PMT, photomultiplier tube. (Bottom) The structure of a lymph node, showing the relative positions of B cell follicles, T cell areas in the diffuse cortex, HEVs, overlying capsule, and lymphatic and circulatory connections.
Figure 2
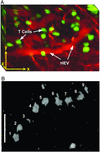
Intravital imaging of vessels and cells in a living lymph node. (A) 3D reconstruction representing a 85 × 120 × 75-μm volume of the T cell area, centered 120 μm below the surface of the lymph node. (Scale bars, 30 μm in all axes.) CFSE-labeled naïve T cells (green) are observed in the vicinity of a presumptive HEV (red), identified by i.v. injection of tetramethylrhodamine dextran. (B) Video-rate imaging of a T cell flowing in a small vessel within a T cell region of the node. Image is a superposition of nine consecutive video frames acquired at 34-ms intervals and shows the progression of a single CFSE-labeled T cell traveling at ≈20 mm⋅min−1 (0.03 cm⋅s−1) within a blood vessel. (Scale bar, 25 μm.)
Figure 3
In vivo motility of T cells. (A) Sequence of images at ≈1-min intervals illustrating T cell migration. Each panel shows a compression along the z axis (top view) derived from a 51-μm-deep _z_-stack. Four individual cells and their corresponding tracks (dots tracked at intervals of 10 s) are pseudocolored for illustration. Times are in min/s. (Scale bar, 20 μm.) (B) Velocity fluctuations of five individual T cells. Velocities were computed point by point from positions during consecutive 10-s intervals. (C) Fourier analysis of velocity fluctuations derived from the velocity traces in B, illustrating cyclical fluctuations with a characteristic period of ≈2 min. (D) Distribution of instantaneous T cell velocities. Lateral (x_–_y) velocities were measured from point-to-point tracks at 10-s intervals (n = 2,930 measurements in three experiments). Velocities <3 μm⋅min−1 correspond to pauses of motile cells rather than to a population of nonmotile cells.
Figure 4
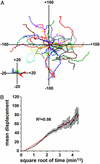
T cell migration proceeds autonomously through the T cell areas. (A) Overlay of 39 individual T cell tracks plotted after aligning their starting positions. Cells were tracked over a 12-min period. (Inset) Shown are the mean coordinates of entire populations of T cells. Units are in μm. (B) Plot shows the mean absolute displacement of individual T cells (n = 3 experiments) away from their starting points as a function of square root of time. A random walk process is expected to yield a straight line on this transformed scale, and the red line shows a linear regression to the data. Error bars are ±SEM.
Figure 5
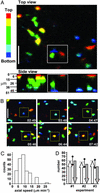
Axial motion of T cells. (Scale bars, 25 μm.) (A) Color encoding of axial position of T cells. Representative images derived from a single _z_-stack, showing compressions along the z axis (top view) and y axis (side view). The axial (z) depth of cells within the stack is encoded by a pseudocolor scheme as illustrated in the side view [red, top 6 μm of stack (closer to the capsule); yellow, 6–15 μm; green, middle 30 μm; cyan, 36–45 μm; blue, 45–51 μm]. (B) Time-lapse image sequence, using color-encoding to allow tracking of T cells in 3D. Boxes frame a cell that began at the bottom of the imaging volume and moved upward toward the capsule. The complete image sequence can be viewed in Movie 1. (C) Distribution of T cell speed in the z axis (up or down). (D) Bar graph showing numbers of cells tracked as moving upward (toward the capsule) or downward. Data are from three experiments. Error bars indicate 95% confidence interval for a binomial distribution consistent with random cell trafficking in the z axis.
Similar articles
- Two-photon imaging of lymphocyte motility and antigen response in intact lymph node.
Miller MJ, Wei SH, Parker I, Cahalan MD. Miller MJ, et al. Science. 2002 Jun 7;296(5574):1869-73. doi: 10.1126/science.1070051. Epub 2002 May 16. Science. 2002. PMID: 12016203 - Imaging the single cell dynamics of CD4+ T cell activation by dendritic cells in lymph nodes.
Miller MJ, Safrina O, Parker I, Cahalan MD. Miller MJ, et al. J Exp Med. 2004 Oct 4;200(7):847-56. doi: 10.1084/jem.20041236. J Exp Med. 2004. PMID: 15466619 Free PMC article. - T cell migration dynamics within lymph nodes during steady state: an overview of extracellular and intracellular factors influencing the basal intranodal T cell motility.
Worbs T, Förster R. Worbs T, et al. Curr Top Microbiol Immunol. 2009;334:71-105. doi: 10.1007/978-3-540-93864-4_4. Curr Top Microbiol Immunol. 2009. PMID: 19521682 Review. - Tissue trafficking patterns of effector memory CD4+ T cells in rheumatoid arthritis.
Zhang X, Nakajima T, Goronzy JJ, Weyand CM. Zhang X, et al. Arthritis Rheum. 2005 Dec;52(12):3839-49. doi: 10.1002/art.21482. Arthritis Rheum. 2005. PMID: 16329093 - Intravital two-photon imaging of T-cell priming and tolerance in the lymph node.
Celli S, Bousso P. Celli S, et al. Methods Mol Biol. 2007;380:355-63. doi: 10.1007/978-1-59745-395-0_22. Methods Mol Biol. 2007. PMID: 17876105 Review.
Cited by
- Biophysical modeling identifies an optimal hybrid amoeboid-mesenchymal phenotype for maximal T cell migration speeds.
Alonso-Matilla R, Provenzano PP, Odde DJ. Alonso-Matilla R, et al. bioRxiv [Preprint]. 2024 Jul 13:2023.10.29.564655. doi: 10.1101/2023.10.29.564655. bioRxiv. 2024. PMID: 39026744 Free PMC article. Preprint. - More than double the fun with two-photon excitation microscopy.
Luu P, Fraser SE, Schneider F. Luu P, et al. Commun Biol. 2024 Mar 26;7(1):364. doi: 10.1038/s42003-024-06057-0. Commun Biol. 2024. PMID: 38531976 Free PMC article. Review. - Vascular regulation of disseminated tumor cells during metastatic spread.
Sturgess V, Azubuike UF, Tanner K. Sturgess V, et al. Biophys Rev (Melville). 2023 Mar 23;4(1):011310. doi: 10.1063/5.0106675. eCollection 2023 Mar. Biophys Rev (Melville). 2023. PMID: 38510161 Free PMC article. Review. - Towards A Wireless Image Sensor for Real-Time Fluorescence Microscopy in Cancer Therapy.
Rabbani R, Najafiaghdam H, Roschelle M, Papageorgiou EP, Zhao BR, Ghanbari MM, Muller R, Stojanovic V, Anwar M. Rabbani R, et al. bioRxiv [Preprint]. 2023 Dec 5:2023.12.03.569779. doi: 10.1101/2023.12.03.569779. bioRxiv. 2023. PMID: 38106190 Free PMC article. Updated. Preprint. - Quantitative analyses of T cell motion in tissue reveals factors driving T cell search in tissues.
Torres DJ, Mrass P, Byrum J, Gonzales A, Martinez DN, Juarez E, Thompson E, Vezys V, Moses ME, Cannon JL. Torres DJ, et al. Elife. 2023 Oct 23;12:e84916. doi: 10.7554/eLife.84916. Elife. 2023. PMID: 37870221 Free PMC article.
References
- Sprent J, Miller J F, Mitchell G F. Cell Immunol. 1971;2:171–181. - PubMed
- Ford W L, Atkins R C. Nat New Biol. 1971;234:178–180. - PubMed
- von Andrian U H, Mackay C R. N Engl J Med. 2000;343:1020–1034. - PubMed
Publication types
MeSH terms
Substances
Grants and funding
- GM-41514/GM/NIGMS NIH HHS/United States
- R01 GM048071/GM/NIGMS NIH HHS/United States
- R37 GM048071/GM/NIGMS NIH HHS/United States
- GM-48071/GM/NIGMS NIH HHS/United States
- R01 GM041514/GM/NIGMS NIH HHS/United States
LinkOut - more resources
Full Text Sources
Other Literature Sources
Research Materials
Miscellaneous


