Interferon-inducible gene expression signature in peripheral blood cells of patients with severe lupus - PubMed (original) (raw)
. 2003 Mar 4;100(5):2610-5.
doi: 10.1073/pnas.0337679100. Epub 2003 Feb 25.
Franak M Batliwalla, George Karypis, Patrick M Gaffney, Ward A Ortmann, Karl J Espe, Katherine B Shark, William J Grande, Karis M Hughes, Vivek Kapur, Peter K Gregersen, Timothy W Behrens
Affiliations
- PMID: 12604793
- PMCID: PMC151388
- DOI: 10.1073/pnas.0337679100
Interferon-inducible gene expression signature in peripheral blood cells of patients with severe lupus
Emily C Baechler et al. Proc Natl Acad Sci U S A. 2003.
Abstract
Systemic lupus erythematosus (SLE) is a complex, inflammatory autoimmune disease that affects multiple organ systems. We used global gene expression profiling of peripheral blood mononuclear cells to identify distinct patterns of gene expression that distinguish most SLE patients from healthy controls. Strikingly, about half of the patients studied showed dysregulated expression of genes in the IFN pathway. Furthermore, this IFN gene expression "signature" served as a marker for more severe disease involving the kidneys, hematopoetic cells, and/or the central nervous system. These results provide insights into the genetic pathways underlying SLE, and identify a subgroup of patients who may benefit from therapies targeting the IFN pathway.
Figures
Figure 1
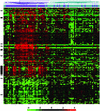
Gene expression profiles of PBMCs from 48 SLE patients and 42 healthy controls. Shown are hierarchical clustering results of microarray data for 161 genes that distinguish lupus patients (dark blue) from healthy controls (aqua). All genes met the following criteria: >1.5-fold difference in mean gene expression levels between patients and controls, difference in mean gene expression level >100 units, and P < 0.001. The individual data points are expressed as the ratio of the expression value to the mean of control expression values. The ratios are depicted according to the scale shown at the bottom, and range from 0.0625 to 16.0 (−4 to 4 on a log2 scale). Red indicates genes expressed at higher levels relative to the control mean, and green represents genes expressed at lower levels than control mean. Black bars on the left side of the figure indicate IFN-regulated genes. See supporting information for identification of individual samples on the clustering tree.
Figure 2
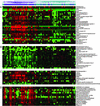
Genes differentially expressed between SLE and control PBMCs. Shown are representative genes from the data shown in Fig. 1. (A) Selected genes generally overexpressed in SLE compared with controls. (B) Selected genes generally underexpressed in SLE compared with controls. (C) IFN-regulated genes that did not show tight clustering in Fig. 1. (D) IFN-regulated genes that comprise the IFN signature shown in Fig. 1.
Figure 3
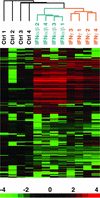
Identification of PBMC genes regulated by IFN. Depicted are 286 genes that showed a 2-fold or greater change in expression, and a difference of >500 expression units after treatment in vitro of normal control PBMCs with IFN-α/β or IFN-γ. For each sample, the expression value for each gene was divided by the average expression level of the 6-h untreated samples. This ratio was then visualized as in Fig. 1.
Figure 4
The IFN expression signature identifies a clinical subset of SLE patients with severe disease. (A) A numerical score was calculated by using the normalized expression levels of the 14 IFN-regulated genes that comprise the IFN signature. The differences between patients and controls were significant, P = 2.8 × 10⁻⁷. (B) Linear regression analysis demonstrates a significant correlation between IFN score and the number of SLE disease criteria (r = 0.51, P = 0.0002). (C) Patients were divided into two groups: IFN-high, the 24 patients with the highest IFN scores; and IFN-low, the 24 patients with the lowest scores. The data compare the two groups for number of ACR criteria for SLE (minimum of 4 to establish the disease, maximum of 11), P = 0.002. (D) The data compare the percent of patients in the IFN-high and IFN-low groups with ACR-defined criteria for renal and/or CNS disease (P = 7.7 × 10⁻⁶) or hematologic involvement (P = 6.1 × 10⁻⁹).
Similar articles
- Autoimmunity gene expression portrait: specific signature that intersects or differentiates between multiple sclerosis and systemic lupus erythematosus.
Mandel M, Gurevich M, Pauzner R, Kaminski N, Achiron A. Mandel M, et al. Clin Exp Immunol. 2004 Oct;138(1):164-70. doi: 10.1111/j.1365-2249.2004.02587.x. Clin Exp Immunol. 2004. PMID: 15373920 Free PMC article. - Gene expression profiling in the study of the pathogenesis of systemic lupus erythematosus.
Qing X, Putterman C. Qing X, et al. Autoimmun Rev. 2004 Nov;3(7-8):505-9. doi: 10.1016/j.autrev.2004.07.001. Autoimmun Rev. 2004. PMID: 15546798 Review. - Isolation and expression profiling of genes upregulated in the peripheral blood cells of systemic lupus erythematosus patients.
Ishii T, Onda H, Tanigawa A, Ohshima S, Fujiwara H, Mima T, Katada Y, Deguchi H, Suemura M, Miyake T, Miyatake K, Kawase I, Zhao H, Tomiyama Y, Saeki Y, Nojima H. Ishii T, et al. DNA Res. 2005;12(6):429-39. doi: 10.1093/dnares/dsi020. Epub 2006 Feb 23. DNA Res. 2005. PMID: 16769699 - Association of a gene expression profile from whole blood with disease activity in systemic lupus erythaematosus.
Nikpour M, Dempsey AA, Urowitz MB, Gladman DD, Barnes DA. Nikpour M, et al. Ann Rheum Dis. 2008 Aug;67(8):1069-75. doi: 10.1136/ard.2007.074765. Epub 2007 Dec 6. Ann Rheum Dis. 2008. PMID: 18063674 - Microarray analysis of gene expression in lupus.
Crow MK, Wohlgemuth J. Crow MK, et al. Arthritis Res Ther. 2003;5(6):279-87. doi: 10.1186/ar1015. Epub 2003 Oct 13. Arthritis Res Ther. 2003. PMID: 14680503 Free PMC article. Review.
Cited by
- Reduced A-to-I editing of endogenous Alu RNAs in lung after SARS-CoV-2 infection.
Crooke PS 3rd, Tossberg JT, Porter KP, Aune TM. Crooke PS 3rd, et al. Curr Res Immunol. 2021;2:52-59. doi: 10.1016/j.crimmu.2021.04.001. Epub 2021 Apr 30. Curr Res Immunol. 2021. PMID: 33969287 Free PMC article. - Effect of proinflammatory cytokines (IL-6, TNF-α, and IL-1β) on clinical manifestations in Indian SLE patients.
Umare V, Pradhan V, Nadkar M, Rajadhyaksha A, Patwardhan M, Ghosh KK, Nadkarni AH. Umare V, et al. Mediators Inflamm. 2014;2014:385297. doi: 10.1155/2014/385297. Epub 2014 Dec 7. Mediators Inflamm. 2014. PMID: 25548434 Free PMC article. - Implications of Endogenous Retroelements in the Etiopathogenesis of Systemic Lupus Erythematosus.
Ukadike KC, Mustelin T. Ukadike KC, et al. J Clin Med. 2021 Feb 19;10(4):856. doi: 10.3390/jcm10040856. J Clin Med. 2021. PMID: 33669709 Free PMC article. Review. - Endosomal trafficking inhibitor EGA can control TLR7-mediated IFNα expression by human plasmacytoid dendritic cells.
Wiest MJ, Baert L, Gu C, Gayler KM, Ham H, Gorvel L, Keddis MT, Griffing LW, Joo H, Gorvel JP, Billadeau DD, Kane RR, Oh S. Wiest MJ, et al. Front Immunol. 2023 Nov 24;14:1202197. doi: 10.3389/fimmu.2023.1202197. eCollection 2023. Front Immunol. 2023. PMID: 38077311 Free PMC article. - Association of the interferon signature metric with serological disease manifestations but not global activity scores in multiple cohorts of patients with SLE.
Kennedy WP, Maciuca R, Wolslegel K, Tew W, Abbas AR, Chaivorapol C, Morimoto A, McBride JM, Brunetta P, Richardson BC, Davis JC Jr, Behrens TW, Townsend MJ. Kennedy WP, et al. Lupus Sci Med. 2015 Mar 28;2(1):e000080. doi: 10.1136/lupus-2014-000080. eCollection 2015. Lupus Sci Med. 2015. PMID: 25861459 Free PMC article.
References
- Wallace D J. Dubois' Lupus Erythematosus. Philadelphia: Williams & Wilkins; 2002.
- Arnett F C, Reveille J D. Rheum Dis Clin North Am. 1992;18:865–892. - PubMed
- Schur P H. Lupus. 1995;4:425–437. - PubMed
- Harley J B, Moser K L, Gaffney P M, Behrens T W. Curr Opin Immunol. 1998;10:690–696. - PubMed
- Wakeland E K, Liu K, Graham R R, Behrens T W. Immunity. 2001;15:397–408. - PubMed
Publication types
MeSH terms
Substances
LinkOut - more resources
Full Text Sources
Other Literature Sources
Medical


