Statistical characterization of ion trap tandem mass spectra from doubly charged tryptic peptides - PubMed (original) (raw)
Statistical characterization of ion trap tandem mass spectra from doubly charged tryptic peptides
David L Tabb et al. Anal Chem. 2003.
Abstract
Collision-induced dissociation (CID) is a common ion activation technique used to energize mass-selected peptide ions during tandem mass spectrometry. Characteristic fragment ions form from the cleavage of amide bonds within a peptide undergoing CID, allowing the inference of its amino acid sequence. The statistical characterization of these fragment ions is essential for improving peptide identification algorithms and for understanding the complex reactions taking place during CID. An examination of 1465 ion trap spectra from doubly charged tryptic peptides reveals several trends important to understanding this fragmentation process. While less abundant than y ions, b ions are present in sufficient numbers to aid sequencing algorithms. Fragment ions exhibit a characteristic series-specific relationship between their masses and intensities. Each residue influences fragmentation at adjacent amide bonds, with Pro quantifiably enhancing cleavage at its N-terminal amide bond and His increasing the formation of b ions at its C-terminal amide bond. Fragment ions corresponding to a formal loss of ammonia appear preferentially in peptides containing Gln and Asn. These trends are partially responsible for the complexity of peptide tandem mass spectra.
Figures
Figure 1
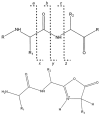
Peptide bond cleavage. Low-energy CID primarily cleaves peptide bonds, resulting in b ions (which contain the N-terminus and the atoms to the left of the dotted line) and y ions (which contain the C-terminus and the atoms to the right of the dotted line). b ions (pictured) generally take on an oxazolone structure, which may subsequently fragment to produce smaller b ions or lose carbon monoxide to form a ions. The remaining possible backbone ions (c, x, z) do not typically form under low-energy conditions.
Figure 2
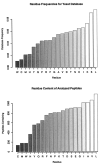
Residue frequencies and content. The peptides included in this analysis have a somewhat modified composition with respect to the sequence database by which they were identified. The residues identified most often among the peptides had alkyl side chains. The six rarest residues in the identified peptides were the same as those seen least often in the sequence database. Cysteine was present in only 134 peptides, and Met and Trp were each present in 178 peptides.
Figure 3
Mass spectrum of the sequence AVDDFLLSLDGTANK. The y5 ion corresponds to the intensity of the median y ion for all spectra in this analysis. The base peak in the above spectrum, which was identified as y8, embodies 9% of the spectrum's total intensity. Identified b and y ions account for 32.4% of this spectrum's total intensity.
Figure 4
Intensity distributions of ion species. Small peaks are more common than intense ones for each series, but the more intense the peak, the more likely it is to represent an ion from the y series. The distribution of peak intensities extends beyond the most intense category in this graph: 31% of y peaks are more intense than 2% of the spectrum's summed intensity, as compared to 9% of b peaks, 3% of a peaks, and 1% of background (x) peaks.
Figure 5
Fragment ion peak height versus relative mass. Peak intensities are related to the relative masses of the fragment ions they represent. The horizontal axis gives masses of fragments as a proportion of precursor mass. The bar shows the intensity of the median peak for the collection of ions in a particular relative mass bin, with a line extending above and below to show the 75th and 25th percentile intensities. Missing peaks are assigned intensities of zero. The y series shows a distinct peak at ∼60% of precursor mass, while b peaks crest at 45%.
Figure 6
Unusual fragmentation of Pro. Because Pro's side chain forms a ring to its nitrogen, attack on its carbonyl carbon by the preceding carbonyl oxygen would result in a strained 5–5 bicyclic ring. Cleavage to its C-terminus is reduced, and cleavage to its N-terminus is encouraged, yielding a large differential between the fragment ion peaks adjacent the residue.
Figure 7
Ratio of intensity differences to intensity sums for individual residues. N-bias measures the extent to which each residue directs local fragmentation. The statistic measures the difference between the N-terminal peak intensity and the C-terminal peak intensity, normalizing this difference by the sum of the two peak intensities. Residues with N-biases of greater absolute value impact local fragmentation to a greater extent. The median bias for each residue is marked by the line across each box, and the upper and lower edges of the boxes represent the 75th and 25th percentiles, respectively. The most distinctive bias toward N-terminal fragmentation is that of Pro. A smaller N-bias appears for Gly and Ser. Hydrophobics Ile, Leu, and Val show a bias toward C-terminal cleavage in y ions, and His shows a pronounced bias toward C-terminal cleavage in b ions.
Figure 8
Histidine cleavage. Histidine can form unusual b ions. In normal fragment ion formation, the carbonyl N-terminal to a residue attacks the carbonyl at the residue's C-terminus, resulting in an intermediate that produces a b ion with a single, five-membered ring. The side chain of His may short-circuit that process by attacking its own carbonyl, yielding a b ion with a double ring structure.
Figure 9
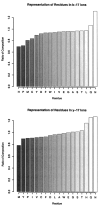
Composition ratio versus the residues in b-17 and y-17 ions. Fragment ions that exhibit prominent loss of ammonia are more likely to contain Asn or Gln than fragment ions in general. Ammonia loss is enhanced by His for y ions, but His suppresses the loss for b ions. Neutral loss of ammonia may be diminished by the presence of Pro and Met. The vertical axis shows the ratio between the sequence composition of the ions displaying intense loss peaks and the sequence composition of fragment ions from the appropriate series.
Figure 10
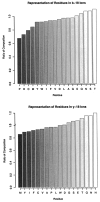
Composition ratio versus the residues in b-18 and y-18 ions. Fragment ions that exhibit prominent loss of water are more likely to contain Ser, Thr, or Glu. As seen in ammonia loss, His appears to enhance loss in y ions but diminish it in b ions. The mass accuracy of the ion trap, combined with the window for identifying peaks in DaughterDB, may result in the misidentification of some ammonia loss peaks as water loss peaks, thus resulting in Asn and Gln's ranking above.
Similar articles
- Calculations of relative intensities of fragment ions in the MSMS spectra of a doubly charged penta-peptide.
Pechan T, Gwaltney SR. Pechan T, et al. BMC Bioinformatics. 2012;13 Suppl 15(Suppl 15):S13. doi: 10.1186/1471-2105-13-S15-S13. Epub 2012 Sep 11. BMC Bioinformatics. 2012. PMID: 23046347 Free PMC article. - Statistical characterization of HCD fragmentation patterns of tryptic peptides on an LTQ Orbitrap Velos mass spectrometer.
Shao C, Zhang Y, Sun W. Shao C, et al. J Proteomics. 2014 Sep 23;109:26-37. doi: 10.1016/j.jprot.2014.06.012. Epub 2014 Jun 27. J Proteomics. 2014. PMID: 24981973 - Statistical characterization of the charge state and residue dependence of low-energy CID peptide dissociation patterns.
Huang Y, Triscari JM, Tseng GC, Pasa-Tolic L, Lipton MS, Smith RD, Wysocki VH. Huang Y, et al. Anal Chem. 2005 Sep 15;77(18):5800-13. doi: 10.1021/ac0480949. Anal Chem. 2005. PMID: 16159109 Free PMC article. - Collisional activation of peptide ions in FT-ICR mass spectrometry.
Laskin J, Futrell JH. Laskin J, et al. Mass Spectrom Rev. 2003 May-Jun;22(3):158-81. doi: 10.1002/mas.10041. Mass Spectrom Rev. 2003. PMID: 12838543 Review. - High-energy collision induced dissociation of biomolecules: MALDI-TOF/RTOF mass spectrometry in comparison to tandem sector mass spectrometry.
Pittenauer E, Allmaier G. Pittenauer E, et al. Comb Chem High Throughput Screen. 2009 Feb;12(2):137-55. doi: 10.2174/138620709787315436. Comb Chem High Throughput Screen. 2009. PMID: 19199883 Review.
Cited by
- Improving Peptide identification using empirical scoring systems.
Chalkley RJ. Chalkley RJ. Methods Mol Biol. 2013;1007:173-82. doi: 10.1007/978-1-62703-392-3_7. Methods Mol Biol. 2013. PMID: 23666726 Free PMC article. - Fragmentation of doubly-protonated Pro-His-Xaa tripeptides: formation of b(2)(2+) ions.
Knapp-Mohammady M, Young AB, Paizs B, Harrison AG. Knapp-Mohammady M, et al. J Am Soc Mass Spectrom. 2009 Nov;20(11):2135-43. doi: 10.1016/j.jasms.2009.07.002. Epub 2009 Jul 10. J Am Soc Mass Spectrom. 2009. PMID: 19683937 - Application of a Novel Hybrid CNN-GNN for Peptide Ion Encoding.
McDonnell K, Abram F, Howley E. McDonnell K, et al. J Proteome Res. 2023 Feb 3;22(2):323-333. doi: 10.1021/acs.jproteome.2c00234. Epub 2022 Dec 19. J Proteome Res. 2023. PMID: 36534699 Free PMC article. - Disfavoring macrocycle b fragments by constraining torsional freedom: the "twisted" case of QWFGLM b6.
Tirado M, Rutters J, Chen X, Yeung A, van Maarseveen J, Eyler JR, Berden G, Oomens J, Polfer NC. Tirado M, et al. J Am Soc Mass Spectrom. 2012 Mar;23(3):475-82. doi: 10.1007/s13361-011-0315-5. Epub 2012 Jan 5. J Am Soc Mass Spectrom. 2012. PMID: 22219043 - Effects of single amino acid substitution on the collision-induced dissociation of intact protein ions: Turkey ovomucoid third domain.
Newton KA, Pitteri SJ, Laskowski M Jr, McLuckey SA. Newton KA, et al. J Proteome Res. 2004 Sep-Oct;3(5):1033-41. doi: 10.1021/pr049910w. J Proteome Res. 2004. PMID: 15473693 Free PMC article.
References
- Washburn MP, Wolters D, Yates JR., III Nat Biotechnol. 2001;19:242–247. - PubMed
- VerBerkmoes NC, Bundy JL, Hauser L, Asano KG, Razumovskaya J, Larimer F, Hettich RL, Stephenson JL., Jr J Proteome Res. 2002;1:239–252. - PubMed
- Peng J, Elias JE, Thoreen CC, Licklider LJ, Gygi SP. J Proteome Res. in press. - PubMed
- Florens L, Washburn MP, Raine JD, Anthony RM, Grainger M, Haynes JD, Moch JK, Muster N, Sacci JB, Tabb DL, Witney AA, Wolters D, Wu Y, Gardner MJ, Holder AA, Sinden RE, Yates JR, Carucci DJ. Nature. 2002;419:520–526. - PubMed
- O'Hair RAJ. J Mass Spectrom. 2000;35:1377–1381. - PubMed
Publication types
MeSH terms
Substances
LinkOut - more resources
Full Text Sources
Other Literature Sources
Molecular Biology Databases


