Interferon and granulopoiesis signatures in systemic lupus erythematosus blood - PubMed (original) (raw)
Interferon and granulopoiesis signatures in systemic lupus erythematosus blood
Lynda Bennett et al. J Exp Med. 2003.
Abstract
Systemic lupus erythematosus (SLE) is a prototype systemic autoimmune disease characterized by flares of high morbidity. Using oligonucleotide microarrays, we now show that active SLE can be distinguished by a remarkably homogeneous gene expression pattern with overexpression of granulopoiesis-related and interferon (IFN)-induced genes. Using the most stringent statistical analysis (Bonferroni correction), 15 genes were found highly up-regulated in SLE patients, 14 of which are targets of IFN and one, defensin DEFA-3, a major product of immature granulocytes. A more liberal correction (Benjamini and Hochberg correction) yielded 18 additional genes, 12 of which are IFN-regulated and 4 granulocyte-specific. Indeed immature neutrophils were identified in a large fraction of SLE patients white blood cells. High dose glucocorticoids, a standard treatment of disease flares, shuts down the interferon signature, further supporting the role of this cytokine in SLE. The expression of 10 genes correlated with disease activity according to the SLEDAI. The most striking correlation (P < 0.001, r = 0.55) was found with the formyl peptide receptor-like 1 protein that mediates chemotactic activities of defensins. Therefore, while the IFN signature confirms the central role of this cytokine in SLE, microarray analysis of blood cells reveals that immature granulocytes may be involved in SLE pathogenesis.
Figures
Figure 1.
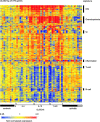
SLE signature. Hierarchical clustering of gene expression data by blood leukocytes of 9 healthy children, 30 with SLE, and 12 with juvenile chronic arthritis including 3 systemic arthritis. The SLE patients have been ranked according to their SLEDAI at time of blood draw. Each row represents a separate gene and each column a separate patient. 374 transcript sequences have been selected which were differentially expressed in SLE by comparison to healthy patients. The normalized expression index for each transcript sequence (rows) in each sample (columns) is indicated by a color code. Red, yellow, and blue squares indicate that expression of the gene is greater than, equal to or less than the mean level of expression across 9 healthy controls. The scale extends from fluorescence ratios of 0.25 to 4.0. Full raw data expression information of the genes in this figure is available upon request to the corresponding authors.
Figure 2.
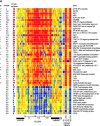
IFN signature. (A) Active SLE patients leukocytes (left panel) display 36 IFN-up-regulated and 13 down-regulated transcript sequences. The same genes are altered in healthy PBMCs cultured in vitro with IFN-α (right panel). Median expression and the number of patients who display more than twofold increase in gene expression. ** Significant after Bonferroni correction, * significant after Benjamini and Hochberg correction. (B) Levels of MCP-1 protein in the 25 available SLE serum samples correlate with the MCP-1 gene expression.
Figure 3.
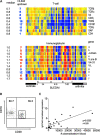
Lymphoid signature: T and B lymphopenia with hypergammaglobulinemia. (A) T cell genes, and the Ig genes. Median expression and the number of patients who display more than twofold increase (red) or decrease (blue) in gene expression. (B) Flow cytometry analysis of purified B cells showing the high frequency of CD19+CD38high plasmablasts. (C) IgG transcript levels correlate with plasmablast numbers.
Figure 4.
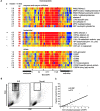
Granulopoiesis signature. (A) Genes have been divided into three categories: enzymes and their inhibitors, bactericidal proteins, and others. Median expression and the number of patients who display more than twofold increase (red) in gene expression. ** Significant after Bonferroni correction, * significant after Benjamini and Hochberg correction. (B) Presence of granular cells in leukocytes that display granulopoiesis-related RNA. Flow cytometry analysis (forward scatter vs. side scatter) of Ficoll-separated mononuclear cells. The gated cells are immature neutrophils. (C) Correlation between the defensin α (DEF3) levels and the numbers of cells gated as shown in B.
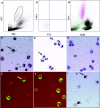
Figure 5.
(A) FSC/SSC analysis of SLE patient #31 PBMCs; (B) Giemsa staining of the same PBMCs (arrow indicates possible early granulocyte); (C) confocal analysis of anti-MPO FITC staining of the same PBMCs. A late band/early segmented granulocyte and a metamyelocyte (arrow) are strongly positive for MPO; (D) sorted CD14 negative granular cells from panel A; (E) Giemsa staining of the sorted cells showing multiple mononuclear cells, including a myelocyte (arrow) and several metamyelocytes, bands and segmented neutrophils; (F) confocal analysis with anti-MPO FITC antibodies show that >95% of the sorted cells express MPO; (G) FSC/SSC analysis of the PBMCs for a second SLE patient (#32); (H) Giemsa staining of the PBMCs from the same patient; (I) three cells from the same patient's PBMCs, including one with monocytoid nucleus (arrow), are positive for MPO.
Figure 6.
Correlation of gene expression and disease activity as measured by SLEDAI. Two IFN-induced genes (Cig49 and phospholipid scramblase 1) and a granulocyte-related gene (F2RPA) correlate significantly with SLEDAI. These particular genes are selected from those in Table III to illustrate different families. By comparison, there is no correlation of serum levels of anti-double stranded DNA antibodies with disease activity.
Figure 7.
Extinction of IFN signature after steroid infusion. Analysis of PBMCs from 3 patients (#30, 25, and 5, see online Table S1) before and after (1–4 d) treatment with high dose intravenous GC (1g/day for 3 d). All patients show down-regulation of IFN-regulated genes. P values on the right indicate significance of the gene expression level before and after GC (paired t test). Patient #5 did not display granulopoiesis signature before high dose GC therapy, 2 other patients do not show alteration in granulocyte-related genes following high dose GC therapy.
Comment in
- Directing autoimmunity to nucleoprotein particles: the impact of dendritic cells and interferon alpha in lupus.
Hardin JA. Hardin JA. J Exp Med. 2003 Mar 17;197(6):681-5. doi: 10.1084/jem.20030130. J Exp Med. 2003. PMID: 12642600 Free PMC article. No abstract available.
Similar articles
- Association of a gene expression profile from whole blood with disease activity in systemic lupus erythaematosus.
Nikpour M, Dempsey AA, Urowitz MB, Gladman DD, Barnes DA. Nikpour M, et al. Ann Rheum Dis. 2008 Aug;67(8):1069-75. doi: 10.1136/ard.2007.074765. Epub 2007 Dec 6. Ann Rheum Dis. 2008. PMID: 18063674 - Microarray analysis of interferon-regulated genes in SLE.
Crow MK, Kirou KA, Wohlgemuth J. Crow MK, et al. Autoimmunity. 2003 Dec;36(8):481-90. doi: 10.1080/08916930310001625952. Autoimmunity. 2003. PMID: 14984025 Review. - Gene expression in systemic lupus erythematosus: bone marrow analysis differentiates active from inactive disease and reveals apoptosis and granulopoiesis signatures.
Nakou M, Knowlton N, Frank MB, Bertsias G, Osban J, Sandel CE, Papadaki H, Raptopoulou A, Sidiropoulos P, Kritikos I, Tassiulas I, Centola M, Boumpas DT. Nakou M, et al. Arthritis Rheum. 2008 Nov;58(11):3541-9. doi: 10.1002/art.23961. Arthritis Rheum. 2008. PMID: 18975309 Free PMC article. - Neutralization of interferon-alpha/beta-inducible genes and downstream effect in a phase I trial of an anti-interferon-alpha monoclonal antibody in systemic lupus erythematosus.
Yao Y, Richman L, Higgs BW, Morehouse CA, de los Reyes M, Brohawn P, Zhang J, White B, Coyle AJ, Kiener PA, Jallal B. Yao Y, et al. Arthritis Rheum. 2009 Jun;60(6):1785-96. doi: 10.1002/art.24557. Arthritis Rheum. 2009. PMID: 19479852 Clinical Trial. - Targeting interferon-alpha: a promising approach for systemic lupus erythematosus therapy.
Schmidt KN, Ouyang W. Schmidt KN, et al. Lupus. 2004;13(5):348-52. doi: 10.1191/0961203304lu1025oa. Lupus. 2004. PMID: 15230291 Review.
Cited by
- IL-21-stimulated human plasmacytoid dendritic cells secrete granzyme B, which impairs their capacity to induce T-cell proliferation.
Karrich JJ, Jachimowski LC, Nagasawa M, Kamp A, Balzarolo M, Wolkers MC, Uittenbogaart CH, Marieke van Ham S, Blom B. Karrich JJ, et al. Blood. 2013 Apr 18;121(16):3103-11. doi: 10.1182/blood-2012-08-452995. Epub 2013 Feb 13. Blood. 2013. PMID: 23407551 Free PMC article. - Immune checkpoints and rheumatic diseases: what can cancer immunotherapy teach us?
van der Vlist M, Kuball J, Radstake TR, Meyaard L. van der Vlist M, et al. Nat Rev Rheumatol. 2016 Oct;12(10):593-604. doi: 10.1038/nrrheum.2016.131. Epub 2016 Aug 19. Nat Rev Rheumatol. 2016. PMID: 27539666 Review. - Autoantibody-Positive Healthy Individuals Display Unique Immune Profiles That May Regulate Autoimmunity.
Slight-Webb S, Lu R, Ritterhouse LL, Munroe ME, Maecker HT, Fathman CG, Utz PJ, Merrill JT, Guthridge JM, James JA. Slight-Webb S, et al. Arthritis Rheumatol. 2016 Oct;68(10):2492-502. doi: 10.1002/art.39706. Arthritis Rheumatol. 2016. PMID: 27059145 Free PMC article. - Endosomal trafficking inhibitor EGA can control TLR7-mediated IFNα expression by human plasmacytoid dendritic cells.
Wiest MJ, Baert L, Gu C, Gayler KM, Ham H, Gorvel L, Keddis MT, Griffing LW, Joo H, Gorvel JP, Billadeau DD, Kane RR, Oh S. Wiest MJ, et al. Front Immunol. 2023 Nov 24;14:1202197. doi: 10.3389/fimmu.2023.1202197. eCollection 2023. Front Immunol. 2023. PMID: 38077311 Free PMC article. - Clinical Application of a Modular Genomics Technique in Systemic Lupus Erythematosus: Progress towards Precision Medicine.
Zollars E, Courtney SM, Wolf BJ, Allaire N, Ranger A, Hardiman G, Petri M. Zollars E, et al. Int J Genomics. 2016;2016:7862962. doi: 10.1155/2016/7862962. Epub 2016 Aug 30. Int J Genomics. 2016. PMID: 27656648 Free PMC article.
References
- Kammer, G.M., and G.C. Tsokos. 1999. Lupus: Molecular and Cellular Pathogenesis. Humana Press, Totowa, NJ. 728 pp.
- Lahita, R.G. 1999. Systemic Lupus Erythematosus. Academic Press. 3rd edition. San Diego, CA. 1051 pp.
- Wakeland, E.K., K. Liu, R.R. Graham, and T.W. Behrens. 2001. Delineating the genetic basis of systemic lupus erythematosus. Immunity. 15:397–408. - PubMed
- Shlomchik, M.J., J.E. Craft, and M.J. Mamula. 2001. From T to B and back again: positive feedback in systemic autoimmune disease. Nat. Rev. Immunol. 1:147–153. - PubMed
- Davidson, A., and B. Diamond. 2001. Autoimmune diseases. N. Engl. J. Med. 345:340–350. - PubMed
Publication types
MeSH terms
Substances
Grants and funding
- N01AI05412/AI/NIAID NIH HHS/United States
- R01 AR046589/AR/NIAMS NIH HHS/United States
- N01-AI-05412/AI/NIAID NIH HHS/United States
- R01 AR46589-01/AR/NIAMS NIH HHS/United States
LinkOut - more resources
Full Text Sources
Other Literature Sources
Medical
