DTASelect and Contrast: tools for assembling and comparing protein identifications from shotgun proteomics - PubMed (original) (raw)
DTASelect and Contrast: tools for assembling and comparing protein identifications from shotgun proteomics
David L Tabb et al. J Proteome Res. 2002 Jan-Feb.
Abstract
The components of complex peptide mixtures can be separated by liquid chromatography, fragmented by tandem mass spectrometry, and identified by the SEQUEST algorithm. Inferring a mixture's source proteins requires that the identified peptides be reassociated. This process becomes more challenging as the number of peptides increases. DTASelect, a new software package, assembles SEQUEST identifications and highlights the most significant matches. The accompanying Contrast tool compares DTASelect results from multiple experiments. The two programs improve the speed and precision of proteomic data analysis.
Figures
Figure 1
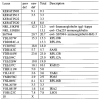
Sample DTASelect.html fragment. Each protein identity is printed beside the count of peptide sequences associated with it. The number of spectra representing those sequences is also shown, along with the protein's sequence coverage, length in residues, molecular weight, calculated pI, and description from the specified database. If multiple proteins in the database correspond to the same set of peptide sequences, the proteins are grouped together. The peptides found for each collection of loci are listed beneath it. Spectra matching the same sequences but possessing different charge states (discernible by the “.2” vs “.3” suffixes on filenames) are not considered duplicates. Peptides that are uniquely found at a particular locus are indicated with asterisks. The fields enumerated for each peptide include file name, XCorr, DeltCN, precursor ion mass, Sp rank, percentage of fragment ions found, copy count, and sequence. Addition symbols (as seen with w26S.0501.0501.1) link to other proteins in the report that also contain the indicated peptide. The similarity for protein YOL055C to YPL258C is reported, showing that one peptide present for YOL055C matches to the other protein and one peptide does not.
Figure 2
Summary tables from DTASelect output for LC/MS/MS and MudPIT analysis of purified 26S protesomes: (A) DTASelect summary output for LC/MS/MS analysis on 4 _μ_g of purified 26S proteosome. Shown are total counts for proteins, peptides, and spectra. The difference between the nonredundant and redundant protein counts reflects that some proteins have been grouped together because of identical sequence coverage. When used with databases that contain a large number of related proteins (such as the human database), DTASelect's grouping functionality is a timesaver. (B) As in (A) except that results are for a MudPIT analysis of 40 _μ_g of purified 26S proteosome.
Figure 3
DTASelect graphical user interface. Identified peaks are color-coded blue for y ions or red b ions. The letters along the top of the window show the correspondence between fragment ions and sequence. Clicking on a peptide will cause its spectrum to be shown. Selecting a protein will show sequence coverage.
Figure 4
Sample Contrast.html fragment. This represents a group of proteins that appear in the new MudPIT sample but not the previous experiment when the same criteria are used against each. Each row in the table represents one protein, and the numbers in the columns are the sequence coverage percentages found in each data set (or, in the Total column, the cumulative sequence coverage across multiple columns). The percentages link to each protein's location in a corresponding DTASelect.html file. If multiple proteins have identical sequence coverage, they are grouped together (for example, NRL_1IKFH and NRL_1INDH). Several such sections appear in each Contrast output file, one for each combination of presence and absence.
Figure 5
Sample Contrast.html summary. Each row in this table represents a particular combination of presence and absence in each of the data sets, with the “X” marks indicating this pattern. Each row's count links back to the appearance of the group above it in the Contrast.html file. Of the 118 proteins appearing, 60 were present in both samples, 18 were present only in the “new” analysis, and 40 were found only in the “prev” experiment.
Figure 6
Sample Verbose Contrast.html fragment. Proteins YDR471W and YHR010W were found in both samples under this criteria set, though with different sequence coverages (17.6% and 21.3%, respectively). One peptide was found in both samples, but the other peptides were found in only one. The highest XCorr for each peptide in each sample is shown beside its sequence. Cumulatively, these peptides add up to 30.9% sequence coverage. The sequence coverage percentages for each sample lead to the relevant sections in the respective DTASelect output files. The cumulative sequence coverage links to a view of the protein's sequence overlaid with the peptide sequences.
References
- Yates JR, III, McCormack AL, Eng JK. Anal Chem. 1996;68:534A–540A. - PubMed
- Yates JR., III Electrophoresis. 1998;19:893–900. - PubMed
- Gatlin CL, Kleeman GR, Hays LG, Link AJ, Yates JR., III Anal Biochem. 1998;263:93–101. - PubMed
- McCormack AL, Schieltz DM, Goode B, Yang S, Barnes G, Drubin D, Yates JR., III Anal Chem. 1997;69:767–776. - PubMed
Publication types
MeSH terms
Substances
LinkOut - more resources
Full Text Sources
Other Literature Sources


