Data extraction from composite oligonucleotide microarrays - PubMed (original) (raw)
Data extraction from composite oligonucleotide microarrays
Ilya Shmulevich et al. Nucleic Acids Res. 2003.
Abstract
Microarray or DNA chip technology is revolutionizing biology by empowering researchers in the collection of broad-scope gene information. It is well known that microarray-based measurements exhibit a substantial amount of variability due to a number of possible sources, ranging from hybridization conditions to image capture and analysis. In order to make reliable inferences and carry out quantitative analysis with microarray data, it is generally advisable to have more than one measurement of each gene. The availability of both between-array and within-array replicate measurements is essential for this purpose. Although statistical considerations call for increasing the number of replicates of both types, the latter is particularly challenging in practice due to a number of limiting factors, especially for in-house spotting facilities. We propose a novel approach to design so-called composite microarrays, which allow more replicates to be obtained without increasing the number of printed spots.
Figures
Figure 1
An illustration of the difference between the standard and proposed approaches to microarray design. The drawing in (a) shows that each gene represented in an oligonucleotide (oligo) is placed into its own individual spot on the glass slide. Drawing (b) shows an example where each spot contains a mixture of two different oligos. Thus, it is expected that the measured signal intensity of such a spot would be a combination of the intensities of the constituent genes measured individually.
Figure 2
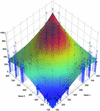
The relationship between the individual gene intensities and the intensities of their mixtures. The axes labeled ‘Gene 1’ and ‘Gene 2’ contain the means of the five replicates of each of the 30 genes, measured individually. The vertical axis shows the intensity of the spots containing the mixtures of every pair of genes. Each of the blue-colored ‘stems’ corresponds to a particular mixture of two genes. Thus, its coordinates on the ‘Gene 1’ and ‘Gene 2’ axes correspond to the means of those two individual genes whereas its height corresponds to the intensity of the mixture. A cubic smoothing spline has been fitted to the data, for visual purposes. The color of the fitted surface corresponds to its height. The plot shows that the mixture signal intensity is an increasing function of the single-gene signal intensities.
Figure 3
(Left) A graph showing the means of the five single-gene replicates (red) and the values reconstructed from the mixtures of the genes (black). Also shown are the bootstrap-based confidence intervals for the means of the five single-gene replicates, with α = 0.01 (blue). (Right) A comparison of the confidence intervals for the means of the five single-gene replicates (blue, same as in the left panel) and the confidence intervals constructed for the values reconstructed from the mixtures (red), with α = 0.01.
Similar articles
- Large scale real-time PCR validation on gene expression measurements from two commercial long-oligonucleotide microarrays.
Wang Y, Barbacioru C, Hyland F, Xiao W, Hunkapiller KL, Blake J, Chan F, Gonzalez C, Zhang L, Samaha RR. Wang Y, et al. BMC Genomics. 2006 Mar 21;7:59. doi: 10.1186/1471-2164-7-59. BMC Genomics. 2006. PMID: 16551369 Free PMC article. - A variable fold change threshold determines significance for expression microarrays.
Mariani TJ, Budhraja V, Mecham BH, Gu CC, Watson MA, Sadovsky Y. Mariani TJ, et al. FASEB J. 2003 Feb;17(2):321-3. doi: 10.1096/fj.02-0351fje. Epub 2002 Dec 3. FASEB J. 2003. PMID: 12475896 - Optimization of oligonucleotide microarray fabricated by spotting 65-mer.
Lee M, Trent JM, Bittner ML. Lee M, et al. Anal Biochem. 2007 Sep 1;368(1):61-9. doi: 10.1016/j.ab.2007.06.005. Epub 2007 Jun 8. Anal Biochem. 2007. PMID: 17618862 Free PMC article. - Genomic profiling: cDNA arrays and oligoarrays.
Gorreta F, Carbone W, Barzaghi D. Gorreta F, et al. Methods Mol Biol. 2012;823:89-105. doi: 10.1007/978-1-60327-216-2_7. Methods Mol Biol. 2012. PMID: 22081341 Review. - Improving reliability and performance of DNA microarrays.
Sievertzon M, Nilsson P, Lundeberg J. Sievertzon M, et al. Expert Rev Mol Diagn. 2006 May;6(3):481-92. doi: 10.1586/14737159.6.3.481. Expert Rev Mol Diagn. 2006. PMID: 16706748 Review.
Cited by
- Compressive sensing DNA microarrays.
Dai W, Sheikh MA, Milenkovic O, Baraniuk RG. Dai W, et al. EURASIP J Bioinform Syst Biol. 2009;2009(1):162824. doi: 10.1155/2009/162824. Epub 2009 Jan 13. EURASIP J Bioinform Syst Biol. 2009. PMID: 19158952 Free PMC article. - In silico microdissection of microarray data from heterogeneous cell populations.
Lähdesmäki H, Shmulevich L, Dunmire V, Yli-Harja O, Zhang W. Lähdesmäki H, et al. BMC Bioinformatics. 2005 Mar 14;6:54. doi: 10.1186/1471-2105-6-54. BMC Bioinformatics. 2005. PMID: 15766384 Free PMC article.
References
- Lipshutz R.J., Fodor,S.P.A., Gingeras,T.R. and Lockhart,D.J. (1999) High density synthetic oligonucleotide arrays. Nature Genet., 21, 20–24. - PubMed
- Hughes T.R., Mao,M., Jones,A.R., Burchard,J., Marton,M.J., Shannon,K.W., Lefkowitz,S.M., Ziman,M., Schelter,J.M., Meyer,M.R. et al. (2001) Expression profiling using microarrays fabricated by an ink-jet oligonucleotide synthesizer. Nat. Biotechnol., 19, 342–347. - PubMed
- Schena M., Shalon,D., Davis,R.W. and Brown,P.O. (1995) Quantitative monitoring of gene expression patterns with a complementary DNA microarray. Science, 270, 467–470. - PubMed
- Duggan D.J., Bittner,M., Chen,Y., Meltzer,P. and Trent,J.M. (1999) Expression profiling using cDNA microarrays. Nature Genet., 21, 10–14. - PubMed
MeSH terms
LinkOut - more resources
Full Text Sources
Miscellaneous


