Kv3 potassium conductance is necessary and kinetically optimized for high-frequency action potential generation in hippocampal interneurons - PubMed (original) (raw)
Kv3 potassium conductance is necessary and kinetically optimized for high-frequency action potential generation in hippocampal interneurons
Cheng-Chang Lien et al. J Neurosci. 2003.
Abstract
Kv3 channels are thought to be essential for the fast-spiking (FS) phenotype in GABAergic interneurons, but how these channels confer the ability to generate action potentials (APs) at high frequency is unknown. To address this question, we developed a fast dynamic-clamp system (approximately 50 kHz) that allowed us to add a Kv3 model conductance to CA1 oriens alveus (OA) interneurons in hippocampal slices. Selective pharmacological block of Kv3 channels by 0.3 mm 4-aminopyridine or 1 mm tetraethylammonium ions led to a marked broadening of APs during trains of short stimuli and a reduction in AP frequency during 1 sec stimuli. The addition of artificial Kv3 conductance restored the original AP pattern. Subtraction of Kv3 conductance by dynamic clamp mimicked the effects of the blockers. Application of artificial Kv3 conductance also led to FS in OA interneurons after complete K+ channel block and even induced FS in hippocampal pyramidal neurons in the absence of blockers. Adding artificial Kv3 conductance with altered deactivation kinetics revealed a nonmonotonic relationship between mean AP frequency and deactivation rate, with a maximum slightly above the original value. Insertion of artificial Kv3 conductance with either lowered activation threshold or inactivation also led to a reduction in the mean AP frequency. However, the mechanisms were distinct. Shifting the activation threshold induced adaptation, whereas adding inactivation caused frequency-dependent AP broadening. In conclusion, Kv3 channels are necessary for the FS phenotype of OA interneurons, and several of their gating properties appear to be optimized for high-frequency repetitive activity.
Figures
Fig. 1.
Gating of Kv3 channels in nucleated patches isolated from OA interneurons. A–D, Kv3 channel-mediated current in nucleated patches isolated by digital subtraction of traces in the presence of 1 m
m
TEA from traces under control conditions. A, B, Activation protocol (−80 to 70 mV in 10 mV increments). C, D, Deactivation protocol (conditioning pulse to 20 mV, steps to −130 to 10 mV in 10 mV increments). Dashed lines indicate baselines. A, C, Recordings in 2.5 m
m
external [K+]. B, D, Recordings in 25 m
m
external [K+] in a different patch. Traces, Single sweeps or averages of up to five sweeps. E, Kv3 channel activation curve. Filled circles indicate 2.5 m
m
external [K+] (n = 10). Conductance (G) was calculated from outward currents by ohmic correction. Open circles indicate 25 m
m
external [K+] (n = 6).G was obtained from the amplitudes of inward tail currents. F, Activation and deactivation kinetics. Activation τ (circles, n = 6–10), delay δ (triangles), and deactivation τ (squares, n = 4–10) are plotted against voltage. Filled symbols indicate 2.5 m
m
external [K+]. Open symbols indicate 25 m
m
external [K+]. Data in 2.5 m
m
external [K+] were partly taken from Lien et al. (2002).E, F, Continuous curves are predictions of the fitted HH-type model (Fig. 2_A_).
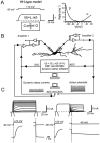
Fig. 2.
Design and performance of the dynamic-clamp system. A, HH-type model of Kv3 channels in OA interneurons. A simulated trace for a test pulse from −90 to 10 mV (left) and rates α and β as a function of potential (right) are shown. B, Schematic illustration of the dynamic-clamp system. Note that two pipettes were used, with both amplifiers in the current-clamp mode. Two electrode recording allowed us to record voltage signals without any_R_S artifacts. The membrane potential is recorded by amplifier 2 and digitized by the ADC of the DSP card. For every time step, the current is calculated from Equation 4 and converted into an analog–voltage signal by the DAC of the DSP card.Arrowheads indicate the direction of signal flow. For details, see Materials and Methods. C, Dynamic-clamp currents obtained in the open-loop configuration with the HH-type model (delay, 0.3 msec; _G_max = 100 nS).Left traces, Currents evoked by the activation protocol (test pulse, −80 to 70 mV in 10 mV increments) are shown. Right traces, Currents evoked by the deactivation protocol (conditioning pulse to 20 mV, steps to −130 to 10 mV in 10 mV increments) are shown. Dashed lines indicate baselines. Expanded activation and deactivation phases are also shown (bottom).
Fig. 3.
Rescue of the AP phenotype by addition of Kv3 conductance with dynamic clamp in the presence of blockers.A, Single APs evoked by 0.5 msec pulses in an OA interneuron (3.5 nA; 1st and 10th AP in a 50 Hz train). Control (short AP) and blocker (long AP; 0.3 m
m
4-AP) (black traces) and APs evoked with artificial Kv3 conductance added by dynamic clamp in the presence of blockers (gray traces) are shown. _G_max was varied from 20 to 200 nS in 20 nS steps. The traces below APs show corresponding dynamic-clamp currents. B, Half-duration of the 10th AP in a 50 Hz train in the presence of 0.3 m
m
4-AP or 1 m
m
TEA after addition of artificial Kv3 conductance, plotted against_G_max (n = 17). The_continuous curve_ represents an exponential function plus constant fitted to the data points. _Dashed lines_indicate the mean half-durations of the AP under control conditions (bottom line) and in the presence of blockers (top line). C, Trains of APs evoked by 1 sec pulses (0.5 nA) in an OA interneuron. Traces were obtained under control conditions in the presence of 0.3 m
m
4-AP and after the addition of artificial Kv3 conductance in the presence of 4-AP; G_max = 110 nS (giving >95% restoration of AP half-duration). The graph at the bottom right illustrates instantaneous AP frequency plotted against time for the three conditions. Data in A and_C are from different cells. Note subtle differences in the time course of reduction of AP amplitude during the train, which may be attributable to differences between the endogenous Kv3 channels expressed in a particular cell and the artificial Kv3 conductance based on average properties. D, Summary graph of mean AP frequency. Open bars indicate means;filled circles indicate single values for control, blocker (0.3 m
m
4-AP or 1 m
m
TEA), and rescue in the presence of blockers (n = 16).
Fig. 4.
Mimicry of the effects of blockers by subtraction of Kv3 conductance with dynamic clamp. A, Single APs evoked by 0.5 msec pulses in an OA interneuron (3.5 nA; 1st and 10th AP in a 50 Hz train). _G_max was varied from −20 to −120 nS in −20 nS steps. Note that AP broadening was induced by subtraction. For _G_max = −120 nS, the effect of subtraction (gray traces) mimics that of the pharmacological block of Kv3 channels (black traces, 0.3 m
m
4-AP; longer AP). Note that the agreement is not perfect, which may be because of cell-to-cell variability in Kv3 channel gating or unspecific effects of the blockers. B, Half-duration of the 10th AP in a 50 Hz train after subtraction of artificial conductance by dynamic clamp, plotted against _G_max (_n_= 10). The curve represents exponential function plus offset fitted to the data points. Dashed lines indicate the mean half-durations of the AP under control conditions (bottom line) and in the presence of blockers (top line).C, Trains of APs evoked by 1 sec pulses (0.5 nA). Traces were obtained under control conditions after subtraction of Kv3 conductance (_G_max = −100 nS) and in the presence of 1 m
m
TEA. The graph at the bottom right illustrates instantaneous AP frequency plotted against time for the three conditions. Data in A and_C_ are from different cells. D, Summary graph of mean AP frequency. Open bars indicate means;filled circles indicate single values for control, blocker (0.3 m
m
4-AP or 1 m
m
TEA), and subtraction in the absence of blockers(n = 5).
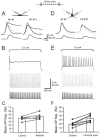
Fig. 5.
Kv3 conductance is sufficient to induce the FS phenotype in two different host-cell types. A–C, Induction of FS phenotype in OA interneurons after complete pharmacological block of voltage-gated K+ channels. Traces were obtained in the presence of 5 m
m
4-AP plus 20 m
m
TEA and after the addition of artificial Kv3 conductance in the presence of blockers. A, Single APs evoked by 0.5 msec pulses (3.5 nA; 1st and 10th AP in a 50 Hz train).B, APs evoked by 1 sec pulses (0.5 nA). Data in_A_ and B are from the same cell (_G_max = 100 nS). C, Summary graph of mean AP frequency. Open bars indicate means; filled circles indicate single values for control and rescue by artificial Kv3 conductance (n = 5). Note that the AP frequency was increased beyond the control value by the artificial Kv3 conductance in four of five cells (“over-rescue”), which may be attributable to the anti-FS effects of voltage-gated K+ channels other than Kv3.D–F, De novo induction of FS phenotype in pyramidal neurons. D, Single APs evoked by 0.5 msec pulses (3.5 nA; 1st and 10th AP in a 50 Hz train) in a CA1 pyramidal neuron. No blockers were applied. E, Trains of APs evoked by 1 sec pulses (0.5 nA, ∼5 times threshold). Traces were obtained under control conditions and after the addition of artificial Kv3 conductance. Data in D and E are from the same cell (_G_max = 100 nS).F, Summary graph of mean AP frequency. Open bars indicate means; filled circles indicate single values for controls and after the addition of artificial Kv3 conductance in the presence of blockers (n = 8).
Fig. 6.
Optimal deactivation kinetics for FS in OA interneurons. A, Schematic illustration of the selective change in deactivation kinetics. B, Trains of APs evoked by 1 sec pulses (0.5 nA). B1, Traces after the addition of artificial Kv3 conductance (deactivation rate unchanged; i.e., deactivation factor _f_β = 1) by dynamic clamp in the presence of 0.3 m
m
4-AP. The graphs at the bottom are histograms of ISIs from 50 sweeps (including B1) recorded from the same cell.B2, Data after the addition of Kv3 channels with a reduced deactivation rate (_f_β= 0.2). B3, Data after the addition of Kv3 channels with an increased deactivation rate (_f_β = 5). Note that the CV of the ISI is much larger in B3 than in B2, suggesting that the mean AP frequency is reduced by different mechanisms. Data in B1–B3 are from the same cell (_G_max = 140 nS). The peak dynamic-clamp current during the first AP is similar in the three conditions (5.31 ± 0.05, 5.42 ± 0.01, and 5.49 ± 0.02 nA).C, Analysis of the mechanisms underlying the reduction of mean AP frequency. C1, Maximal rate of rise of the AP. C2, Peak AP potential. C3, Peak fAHP potential. Filled circles,_f_β = 1; open squares,_f_β = 0.2; open circles, _f_β = 5.Lines connect data points for a single condition.D, A three-dimensional representation of mean AP frequency during the 1 sec pulse against_f_β and the amplitude of the current pulse. Every line crossing represents a mean frequency value (n = 3–7). Note that the maximal AP frequency is reached at _f_β ≈1.2, corresponding to a deactivation rate slightly above the original value.
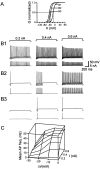
Fig. 7.
A high activation threshold facilitates FS, whereas a low activation threshold leads to adaptation.A, Schematic illustration of the change in midpoint potential _V_1/2 of the activation curve. Dashed lines indicate midpoint potentials.B, Trains of APs evoked by 1 sec pulses (stimulus current of 0.2, 0.4, and 0.6 nA). Traces were obtained after the addition of artificial Kv3 conductance in the presence of 1 m
m
TEA. B1, Data for the addition of original Kv3. B2, B3, Data for the addition of Kv3 after the shift of _V_1/2 by −20 mV (B2) or −30 mV (B3). Note the strong adaptation induced by the shift of _V_1/2. Data in B1–B3 are from the same cell (_G_max = 110 nS). C, A three-dimensional representation of mean AP frequency during the 1 sec pulse against the change in _V_1/2 and the amplitude of the current pulse. Every _line crossing_represents a mean frequency value (n = 7). Note that a shift to more negative potentials reduces the mean AP frequency by promoting adaptation.
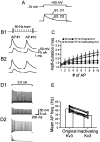
Fig. 8.
Noninactivating channels promote FS, whereas inactivating channels lead to activity-dependent AP broadening.A, Schematic illustration of the change in inactivation.B, Single APs evoked by 0.5 msec pulses (3.5 nA; 1st and 10th AP in a 50 Hz train). Traces were obtained in the presence of 1 m
m
TEA after the addition of either original Kv3 channels (B1) or inactivating Kv3 channels (B2).C, Half-duration of APs in a high-frequency train in the presence of 1 m
m
TEA after the addition of artificial Kv3 conductance. Filled symbols, original Kv3; open symbols, inactivating Kv3 channels (n = 4).Circles indicate 50 Hz stimulation;squares indicate 70 Hz stimulation. _Lines_connect data points for a single condition. D, Trains of APs evoked by 1 sec pulses (0.5 nA). Traces were obtained in the presence of 1 m
m
TEA after the addition of either original Kv3 channels (D1) or inactivating Kv3 channels (D2). Note that the AP-related dynamic-clamp current decreases substantially in B2 and D2_during the train of APs, indicating cumulative inactivation. Data in_B and D were obtained from the same cell (_G_max = 160 nS). E, Summary graph of mean AP frequency. Open bars indicate means; filled circles indicate single values for original Kv3; open circles indicate inactivating Kv3 (n = 11).
Similar articles
- Functional and molecular differences between voltage-gated K+ channels of fast-spiking interneurons and pyramidal neurons of rat hippocampus.
Martina M, Schultz JH, Ehmke H, Monyer H, Jonas P. Martina M, et al. J Neurosci. 1998 Oct 15;18(20):8111-25. doi: 10.1523/JNEUROSCI.18-20-08111.1998. J Neurosci. 1998. PMID: 9763458 Free PMC article. - Function of specific K(+) channels in sustained high-frequency firing of fast-spiking neocortical interneurons.
Erisir A, Lau D, Rudy B, Leonard CS. Erisir A, et al. J Neurophysiol. 1999 Nov;82(5):2476-89. doi: 10.1152/jn.1999.82.5.2476. J Neurophysiol. 1999. PMID: 10561420 - Specific functions of synaptically localized potassium channels in synaptic transmission at the neocortical GABAergic fast-spiking cell synapse.
Goldberg EM, Watanabe S, Chang SY, Joho RH, Huang ZJ, Leonard CS, Rudy B. Goldberg EM, et al. J Neurosci. 2005 May 25;25(21):5230-5. doi: 10.1523/JNEUROSCI.0722-05.2005. J Neurosci. 2005. PMID: 15917463 Free PMC article. - Kv3 channels: voltage-gated K+ channels designed for high-frequency repetitive firing.
Rudy B, McBain CJ. Rudy B, et al. Trends Neurosci. 2001 Sep;24(9):517-26. doi: 10.1016/s0166-2236(00)01892-0. Trends Neurosci. 2001. PMID: 11506885 Review. - Structural insights into the function, dysfunction and modulation of Kv3 channels.
Covarrubias M, Liang Q, Nguyen-Phuong L, Kennedy KJ, Alexander TD, Sam A. Covarrubias M, et al. Neuropharmacology. 2025 Sep 1;275:110483. doi: 10.1016/j.neuropharm.2025.110483. Epub 2025 Apr 25. Neuropharmacology. 2025. PMID: 40288604 Review.
Cited by
- Ionic Current Variability and Functional Stability in the Nervous System.
Golowasch J. Golowasch J. Bioscience. 2014 Jul;64(7):570-580. doi: 10.1093/biosci/biu070. Bioscience. 2014. PMID: 26069342 Free PMC article. - Low-frequency Stimulation Decreases Hyperexcitability Through Adenosine A1 Receptors in the Hippocampus of Kindled Rats.
Shojaee A, Zareian P, Mirnajafi-Zadeh J. Shojaee A, et al. Basic Clin Neurosci. 2020 May-Jun;11(3):333-347. doi: 10.32598/bcn.11.2.1713.1. Epub 2020 May 1. Basic Clin Neurosci. 2020. PMID: 32963726 Free PMC article. - Metabotropic glutamate receptor subtype 1 regulates sodium currents in rat neocortical pyramidal neurons.
Carlier E, Sourdet V, Boudkkazi S, Déglise P, Ankri N, Fronzaroli-Molinieres L, Debanne D. Carlier E, et al. J Physiol. 2006 Nov 15;577(Pt 1):141-54. doi: 10.1113/jphysiol.2006.118026. Epub 2006 Aug 24. J Physiol. 2006. PMID: 16931548 Free PMC article. - Machine learning reveals common transcriptomic signatures across rat brain and placenta following developmental organophosphate ester exposure.
Newell AJ, Jima D, Reading B, Patisaul HB. Newell AJ, et al. Toxicol Sci. 2023 Aug 29;195(1):103-122. doi: 10.1093/toxsci/kfad062. Toxicol Sci. 2023. PMID: 37399109 Free PMC article. - Chronic Ca2+ influx through voltage-dependent Ca2+ channels enhance delayed rectifier K+ currents via activating Src family tyrosine kinase in rat hippocampal neurons.
Yang YS, Jeon SC, Kim DK, Eun SY, Jung SC. Yang YS, et al. Korean J Physiol Pharmacol. 2017 Mar;21(2):259-265. doi: 10.4196/kjpp.2017.21.2.259. Epub 2017 Feb 21. Korean J Physiol Pharmacol. 2017. PMID: 28280420 Free PMC article.
References
- Atzori M, Lau D, Tansey EP, Chow A, Ozaita A, Rudy B, McBain CJ. H2 histamine receptor-phosphorylation of Kv3.2 modulates interneuron fast spiking. Nat Neurosci. 2000;3:791–798. - PubMed
Publication types
MeSH terms
Substances
LinkOut - more resources
Full Text Sources
Miscellaneous


