Synchronized formation and remodeling of postsynaptic densities: long-term visualization of hippocampal neurons expressing postsynaptic density proteins tagged with green fluorescent protein - PubMed (original) (raw)
Synchronized formation and remodeling of postsynaptic densities: long-term visualization of hippocampal neurons expressing postsynaptic density proteins tagged with green fluorescent protein
Tatsuhiko Ebihara et al. J Neurosci. 2003.
Abstract
To explore mechanisms governing the formation and remodeling of postsynaptic density (PSD), we used dissociated cultures of hippocampal neurons isolated from transgenic embryos expressing green fluorescent protein (GFP)-tagged PSD proteins PSD-Zip45 (Homer 1c) and PSD-95. Expression of GFP-tagged PSD molecules was stable, and the remodeling process of PSDs could be followed for >1 week. A higher expression level of GFP-PSD-Zip45 enabled us to quantitatively analyze the amount of PSD-Zip45 clusters during development. Repetitive imaging of the same cell populations between 11 and 17 d in culture revealed an increase of the average PSD-Zip45 cluster density from 0.32 to 0.73/microm. Newly generated dendrites rapidly acquired GFP-PSD-Zip45 clusters, and their density reached the level of parental dendrites within a few days. Temporal profiles of GFP-PSD-Zip45 cluster density showed a variety of patterns. Some dendrites showed a monotonous increase of clusters, whereas others showed complex patterns, including short decremental stages. Analysis of long-term remodeling of PSD-95-GFP clusters confirmed that the decremental stages were not specific to the PSD-Zip45 clusters. Comparison of the temporal profiles of the cluster density among neurons indicated synchronization of both GFP-PSD-Zip45 and PSD-95 clustering within individual cells. Furthermore, activation of cAMP-dependent protein kinase suppressed the decremental stages of cluster remodeling. These observations suggest the presence of signaling mechanisms that can induce synchronized addition or elimination of PSD proteins throughout dendritic arborization of a single neuron.
Figures
Fig. 1.
Expression of the GFP-PSD-Zip45 transgene in the hippocampus. A, Laser confocal microscopy of the CA1 region from β-actin promoter GFP transgenic mice revealed strong GFP fluorescence in the pyramidal cell layer (Pyr). Dendrites of CA1 pyramidal neurons also showed GFP fluorescence in the stratum radiatum (Rad) and stratum oriens (Ori). B, C, Laser confocal microscopy of the CA1 region from the β-actin promoter GFP-PSD-Zip45 transgenic mice revealed GFP fluorescence (B, green) in both the stratum radiatum (Rad) and the stratum oriens (Ori). The distribution of GFP-PSD-Zip45 was similar to that of synapsin I immunoreactivity (C, red). D–F, Higher-magnification view of the stratum radiatum of the β-actin promoter GFP-PSD-Zip45 transgenic mice. GFP clusters (D, arrows) were in close apposition to the clusters of synapsin I (E, arrows). F, Superposition of D and E. Scale bars:A–C, 50 μm; D–F, 5 μm.
Fig. 2.
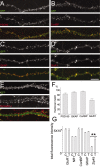
Localization of GFP-PSD-Zip45 in cultured hippocampal neurons isolated from the GFP-PSD-Zip45 transgenic mice.A–E, Colocalization of GFP-PSD-Zip45 with PSD-95 (A), CortBP (B), GKAP (C), GluR1 (D), and synapsin I (E). In the merged color images, the_green_ channel shows the GFP-PSD-Zip45 distribution, and the red channel shows the immunoreactivity of synaptic markers. F, Fractional match of GFP-PSD-Zip45 clusters with PSD-95, GKAP, CortBP, and GluR1 immunoreactivities in the postsynaptic dendrites. G, Effects of GFP-PSD-Zip45 overexpression by the transgene on the assembly of PSD molecules. Average fluorescence intensities of GluR1, NR1, CortBP, and GKAP clusters were not significantly different between the transgenic mice-derived neurons and the wild-type neurons. Average fluorescence intensity of PSD-Zip45 clusters immunostained with anti-PSD-Zip45 antibody showed 130% overexpression of PSD-Zip45 in the transgenic mice-derived neurons. This difference was statistically significant (**p < 0.01). Scale bar, 10 μm.
Fig. 3.
Expression of the PSD-95-GFP transgene in the hippocampus and in cultured hippocampal neurons. _A, B,Laser confocal microscopy of the CA1 region from the β-actin promoter PSD-95-GFP transgenic mice revealed GFP fluorescence (A, green) in both the stratum radiatum (Rad) and the stratum oriens (Ori). The distribution of PSD-95-GFP was similar to that of synaptophysin immunoreactivity (B, red). C–E, Higher-magnification view of the stratum radiatum of the β-actin promoter PSD-95-GFP transgenic mice. GFP clusters (C, arrows) were in close apposition to the clusters of synaptophysin (D, arrows).E, Superposition of C and_D. Pyr, Pyramidal cell layer. Scale bars:A, B, 100 μm; C–E, 5 μm.F, Confocal images of PSD-95-GFP (green) and PSD-95 immunoreactivity (red) in a mixed culture of PSD-95-GFP-expressing neurons and wild-type neurons. Anti-PSD-95 staining in the PSD-95-GFP-expressing neurons (arrows) is slightly higher than that in the wild-type neurons (arrowheads). G, Confocal images of PSD-95-GFP (green) and PSD-Zip45 immunoreactivity (red) in neurons derived from the PSD-95-GFP transgenic mice (arrows) and the wild-type mice (arrowheads). A similar level of anti-PSD-Zip45 staining was observed in two types of cells. Scale bar (F, G), 10 μm. H, Average fluorescence intensity of PSD-95-GFP clusters immunostained with anti-PSD-95 and anti-PSD-Zip45 antibodies. The analysis revealed only 18% overexpression of PSD-95 in the transgenic mice-derived neurons. The difference of the amount of PSD-Zip45 was not statistically significant. C, Neurons derived from wild-type mice;T, neurons derived from PSD-95-GFP transgenic mice.
Fig. 4.
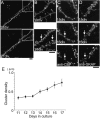
Long-term remodeling of GFP-PSD-Zip45 clusters in cultured hippocampal neurons. A, B, Remodeling of the same dendrite from 13 to 21 d in culture (div).B, Higher-magnification views of the regions enclosed by the white boxes in A. Thin filopodia disappeared, and short spines with GFP clusters within their heads were generated (arrows). C, D, Colocalization of newly formed GFP-PSD-Zip45 clusters with other PSD molecules. Newly generated GFP clusters (arrows) between 15 and 16 d in culture were immunoreactive with anti-CortBP antibody (anti-CBP) and anti-GKAP antibody (anti-GKAP). E, Steady increase of the average density of GFP-PSD-Zip45 clusters in culture. Scale bars, 5 μm.
Fig. 5.
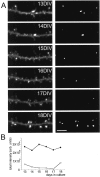
Dendritic segments showing monotonous increase of the GFP-PSD-Zip45 clusters. A, Time-lapse images of the dendritic segment showing monotonous increase of the clusters. The_right panels_ show the binary images of clusters extracted from the original fluorescence images on the_left_. B, Changes in the average intensity values of the GFP-PSD-Zip45 clusters (filled circles) and the dendritic shaft (open circles).C, Changes in the sum of the intensity values within individual GFP-PSD-Zip45 clusters. The differences in the total fluorescence per cluster were not statistically significant.D, Changes in the sum of the intensity value in all clusters (open circles) and within the shaft region (filled circles). There was a 1.8-fold increase of the total cluster intensity, whereas that within the dendritic shaft region remained stable. DIV, Days in culture. Scale bar, 5 μm.
Fig. 6.
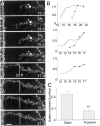
Rapid increase of GFP-PSD-Zip45 clusters in newly generated dendritic segments. A, Time-lapse images showing the initiation of dendritic sprouting at 17 d in culture. A newly generated dendrite in the distal portion (D) formed fluorescent clusters rapidly, whereas the density of fluorescent clusters in the proximal dendritic segment (P) was relatively stable. _B,_Changes in the densities of GFP-PSD-Zip45 clusters in the distal, newly formed dendritic segments (filled circles) and the proximal, preexisting dendritic segments (open circles). Measurements of three neurons from three independent culture preparations were presented. C, Rate of cluster density increase in the distal and proximal part of the sprouting dendrites. Data are derived from analysis of a total of nine neurons in five independent culture preparations (**p < 0.01). Scale bar, 5 μm.
Fig. 7.
Dendritic segments showing a complex pattern of GFP-PSD-Zip45 cluster remodeling. A, Time-lapse images of the dendritic segment showing a complex pattern of cluster remodeling. The right panels show the binary images of clusters extracted from the original fluorescence images on the_left_. B, Changes in the total intensity values within clusters (open circles) and within the shaft region (filled circles). The total intensity values of the clusters showed a gradual decrease and a subsequent abrupt increase (open circles), whereas those within the dendritic shaft region were relatively stable (filled circles). DIV, Days in culture. Scale bar, 5 μm.
Fig. 8.
Correlation of the pattern of GFP-PSD-Zip45 cluster change within single neurons. A, Dendritic morphology of three hippocampal neurons expressing GFP-PSD-Zip45 in the same culture preparation. The densities of fluorescent clusters within the region enclosed by the green rectangles were measured. B, Patterns of the cluster density change in the four dendritic regions shown in A. The patterns between the dendrites of the same cell appeared to be similar, whereas the patterns between the different cells appeared to be distinct.C, Correlation coefficients calculated from the temporal patterns shown in B. There was a tendency that the average correlation coefficients between dendrites of the same cell (1-1, 2-2, 3-3) were higher than those between different cells (1-2, 1-3, 2-3). D, The average correlation coefficients between dendrites of the same cell were significantly higher that those between different cells. Data are derived from analysis of a total of 60 dendritic segments in five independent culture preparations (**p < 0.01). Scale bar, 50 μm.
Fig. 9.
Temporal patterns of cluster remodeling and spatial distribution of dendritic segments. _A,_GFP-PSD-Zip45-expressing neuron and the positions of 10 μm dendritic segments analyzed for cluster density change. Cluster densities of 13 segments in four primary and secondary dendrites were analyzed.B, Relationship between the correlation coefficients of two dendritic segments and the distance between the segments along dendritic shafts. The correlation coefficients of the temporal patterns of cluster density changes were calculated for 78 pairs of dendritic segments. The dashed line is the best fit correlation line (slope = −4.2 × 10⁻⁴;p > 0.65). C, Pseudocolor presentation of the correlation coefficients of 78 pairs of dendritic segments. Here, 13 dendritic segments were classified into four dendritic domains, according to their relative positions to the branch points of the dendrites. A single dendritic domain corresponds to the dendritic structure without any intervening branch points.D, The average correlation coefficients between dendritic segments within the same dendritic domains (I) or between segments of different dendritic domains (E). Data from four different cells in three different culture preparations are presented. The differences were not statistically significant in all pairs (p > 0.65). Scale bar, 25 μm.
Fig. 10.
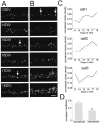
Long-term remodeling of PSD-95-GFP clusters in cultured hippocampal neurons. A, B, Remodeling of the same dendrites from 13 to 18 d in culture (DIV). Image sequences in A show a dendritic segment with monotonous increase of the PSD-95 clusters. Although the density of the PSD-95-GFP clusters increased with time, disappearance of preexisting clusters was frequent (A, arrows). A dendritic segment showing a complex pattern of PSD-95-GFP cluster remodeling (B) was also observed. In this image sequence, large PSD-95-GFP clusters present in the first image (arrows) were disassembled 24 hr later. Subsequently, rapid increase of the PSD-95-GFP clusters was observed at 17 and 18 d in culture. Scale bar (A, B), 5 μm.C, Patterns of the cluster density change in two dendritic regions of three cells present in the same culture preparation. The patterns between the dendrites of the same cells appeared to be similar, whereas the patterns between the different cells were distinct. D, The average correlation coefficients between dendrites of the same cell were significantly higher than those between different cells. Data are derived from analysis of a total of 26 dendritic segments in four independent culture preparations (**p < 0.01).
Fig. 11.
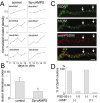
Suppression of GFP-PSD-Zip45 cluster elimination by activation of cAMP-dependent signaling mechanisms. _A,_Patterns of cluster density change in four dendritic segments of a single neuron. Cells were either treated with 100 μ
m
Sp-cAMPS from 11 to 15 d in culture or unperturbed. The temporal profiles of the control neurons show decremental phases of cluster remodeling. The decremental phases were less prominent in neurons treated with Sp-cAMPS. B, The average cluster elimination index (the cumulative number of eliminated clusters divided by the sum of the cluster numbers; see Materials and Methods) was significantly reduced in cells treated with Sp-cAMPS. Data are derived from analysis of a total of 12 dendritic segments in four neurons for both control and treated culture preparations (*p< 0.05). Two independent culture preparations showed similar effects of Sp-cAMPS (suppression of cluster elimination indexes were 41.1 and 41.4% of the controls). C, Retrospective immunocytochemistry of GFP-PSD-Zip45 expressing neurons with anti-PSD-95 antibody. After recording of the GFP-fluorescence from 11 to 16 d in culture (DIV), cells were fixed and immunostained with anti-PSD-95 antibody. The temporal patterns of cluster remodeling were analyzed for each dendritic segment, and the segments in the decremental phase were analyzed for the presence of PSD-95 clusters at the dendritic domains where GFP-PSD-Zip45 clusters disappeared (arrows). Scale bar, 5 μm.D, Absence of PSD-95 clusters in the dendritic domains that had lost GFP-PSD-Zip45 clusters. More than 90% of the dendritic domains were immunonegative with anti-PSD-95 antibody both in the absence and presence of Sp-cAMPS.
Fig. 12.
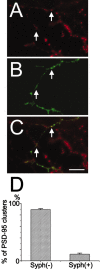
Identification of the PSD structures associated with a single afferent fiber. A–C, Fluorescence images of the dendritic field expressing PSD-95-YFP (A, red) and a single incoming axon expressing synaptophysin-CFP (B, green). The contact sites between these two fluorescent clusters can be identified in the superimposed image (C, arrows). D, The fraction of PSD-95 clusters in a single postsynaptic cell making contact with synaptophysin puncta derived from a single axon (Syph(+)) was only 11.7% of the total PSD-95 clusters. In turn, the fraction of PSD-95 clusters without presynaptic fluorescent clusters (Syph(−)), possibly associated with other axons, was 88.3%. Data were derived from analysis of a total of 10 PSD-95-YFP-expressing neurons in two independent culture preparations. Scale bar, 10 μm.
Similar articles
- Rapid redistribution of the postsynaptic density protein PSD-Zip45 (Homer 1c) and its differential regulation by NMDA receptors and calcium channels.
Okabe S, Urushido T, Konno D, Okado H, Sobue K. Okabe S, et al. J Neurosci. 2001 Dec 15;21(24):9561-71. doi: 10.1523/JNEUROSCI.21-24-09561.2001. J Neurosci. 2001. PMID: 11739567 Free PMC article. - Continual remodeling of postsynaptic density and its regulation by synaptic activity.
Okabe S, Kim HD, Miwa A, Kuriu T, Okado H. Okabe S, et al. Nat Neurosci. 1999 Sep;2(9):804-11. doi: 10.1038/12175. Nat Neurosci. 1999. PMID: 10461219 - Drebrin-dependent actin clustering in dendritic filopodia governs synaptic targeting of postsynaptic density-95 and dendritic spine morphogenesis.
Takahashi H, Sekino Y, Tanaka S, Mizui T, Kishi S, Shirao T. Takahashi H, et al. J Neurosci. 2003 Jul 23;23(16):6586-95. doi: 10.1523/JNEUROSCI.23-16-06586.2003. J Neurosci. 2003. PMID: 12878700 Free PMC article. - Signal transduction molecules at the glutamatergic postsynaptic membrane.
Kennedy MB. Kennedy MB. Brain Res Brain Res Rev. 1998 May;26(2-3):243-57. doi: 10.1016/s0165-0173(97)00043-x. Brain Res Brain Res Rev. 1998. PMID: 9651538 Review. - MAGUKs: multifaceted synaptic organizers.
Won S, Levy JM, Nicoll RA, Roche KW. Won S, et al. Curr Opin Neurobiol. 2017 Apr;43:94-101. doi: 10.1016/j.conb.2017.01.006. Epub 2017 Feb 23. Curr Opin Neurobiol. 2017. PMID: 28236779 Free PMC article. Review.
Cited by
- Complement and microglia mediate early synapse loss in Alzheimer mouse models.
Hong S, Beja-Glasser VF, Nfonoyim BM, Frouin A, Li S, Ramakrishnan S, Merry KM, Shi Q, Rosenthal A, Barres BA, Lemere CA, Selkoe DJ, Stevens B. Hong S, et al. Science. 2016 May 6;352(6286):712-716. doi: 10.1126/science.aad8373. Epub 2016 Mar 31. Science. 2016. PMID: 27033548 Free PMC article. - Quantification of amyloid precursor protein and tau for the study of axonal traffic pathways.
Goldsbury C, Thies E, Konzack S, Mandelkow EM. Goldsbury C, et al. J Neurosci. 2007 Mar 28;27(13):3357-63. doi: 10.1523/JNEUROSCI.5024-06.2007. J Neurosci. 2007. PMID: 17392450 Free PMC article. No abstract available. - The spatial distribution of glutamatergic inputs to dendrites of retinal ganglion cells.
Jakobs TC, Koizumi A, Masland RH. Jakobs TC, et al. J Comp Neurol. 2008 Sep 10;510(2):221-36. doi: 10.1002/cne.21795. J Comp Neurol. 2008. PMID: 18623177 Free PMC article. - Long-term relationships between synaptic tenacity, synaptic remodeling, and network activity.
Minerbi A, Kahana R, Goldfeld L, Kaufman M, Marom S, Ziv NE. Minerbi A, et al. PLoS Biol. 2009 Jun 23;7(6):e1000136. doi: 10.1371/journal.pbio.1000136. Epub 2009 Jun 23. PLoS Biol. 2009. PMID: 19554080 Free PMC article. - Developmental stage-dependent regulation of spine formation by calcium-calmodulin-dependent protein kinase IIα and Rap1.
Cornelia Koeberle S, Tanaka S, Kuriu T, Iwasaki H, Koeberle A, Schulz A, Helbing DL, Yamagata Y, Morrison H, Okabe S. Cornelia Koeberle S, et al. Sci Rep. 2017 Oct 17;7(1):13409. doi: 10.1038/s41598-017-13728-y. Sci Rep. 2017. PMID: 29042611 Free PMC article.
References
- Ahmari SE, Buchanan J, Smith SJ. Assembly of presynaptic active zones from cytoplasmic transport packets [see comments]. Nat Neurosci. 2000;3:445–451. - PubMed
- Brakeman PR, Lanahan AA, O'Brien R, Roche K, Barnes CA, Huganir RL, Worley PF. Homer: a protein that selectively binds metabotropic glutamate receptors. Nature. 1997;386:284–288. - PubMed
- El-Husseini AE, Schnell E, Chetkovich DM, Nicoll RA, Bredt DS. PSD-95 involvement in maturation of excitatory synapses. Science. 2000;290:1364–1368. - PubMed
- El-Husseini AE, Schnell E, Dakoji S, Sweeney N, Zhou Q, Prange O, Gauthier-Campbell C, Aguilera-Moreno A, Nicoll RA, Bredt DS. Synaptic strength regulated by palmitate cycling on PSD-95. Cell. 2002;108:849–863. - PubMed
Publication types
MeSH terms
Substances
LinkOut - more resources
Full Text Sources

