A noninvasive genetic/pharmacologic strategy for visualizing cell morphology and clonal relationships in the mouse - PubMed (original) (raw)
A noninvasive genetic/pharmacologic strategy for visualizing cell morphology and clonal relationships in the mouse
Tudor C Badea et al. J Neurosci. 2003.
Abstract
Analysis of cellular morphology is the most general approach to neuronal classification. With the increased use of genetically engineered mice, there is a growing need for methods that can selectively visualize the morphologies of specified subsets of neurons. This capability is needed both to define cell morphologic phenotypes and to mark cells in a noninvasive manner for lineage studies. To this end, we describe a bipartite genetic system based on a Cre-estrogen receptor (ER) fusion protein that irreversibly activates a plasma membrane-bound alkaline phosphatase reporter gene by site-specific recombination. Because the efficiency and timing of gene rearrangement is controlled pharmacologically, a sparse subset of labeled cells can be generated from the set of CreER-expressing cells at any time during development. Histochemical visualization of alkaline phosphatase activity reveals neuronal morphology with strong and uniform labeling of all processes.
Figures
Fig. 1.
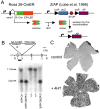
General strategy and generation of knock-in mice.A, Outline of the R26CreER;ZAP labeling strategy. The CreER fusion protein is expressed ubiquitously from the Rosa26 locus. After systemic exposure to 4HT, activated CreER catalyzes recombination between loxP sites at the ZAP reporter locus, allowing transcription of the downstream AP coding region. The efficiency of recombination is dependent on the amount of 4HT delivered. ER-LBD, Estrogen receptor ligand-binding domain mutated to recognize 4HT; SA, splice acceptor;STOP, three-tandem polyA addition sites.B, Generation of the R26CreER knock-in mouse.Top, Map of the Rosa26 locus showing the_Xba_I site (X) used for insertion of the CreER-PGK-neo cassette, the Eco_RV restriction sites (R) used for genotyping, and exons 1–3 of the Rosa26 gene. The Southern blot probe is shown as a_black bar. The expected sizes of the hybridizing bands from knock-in and wild-type alleles are 3 and 11 kb, respectively.Bottom, Southern blots of DNA from mice of the indicated genotypes. C, Flat mounts of adult retinas from R26CreER/+;ZAP/+ mice stained with NBT/BCIP. Top, Uninjected control; bottom, after three intraperitoneal injections of 250 μg of 4HT at P7, P8, and P9.
Fig. 2.
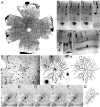
Morphology of retinal cells. Retinas from adult CreER/+;ZAP/+ mice that had received 3 mg of 4HT ∼1 week before staining (A–H) or 0.8 mg of 4HT at P20 (I–Q). These doses of 4HT produce a relatively low density of AP+ cells, appropriate for characterizing individual cell morphologies. Retinal whole mounts were stained with NBT/BCIP, and images were collected with Nomarsky optics to reveal the retinal cell layers. A, Retina flat mount. _B–H,_Perpendicular sections at a thickness of ∼500 μm. The photoreceptor layer is at the top. B–D, Three focal planes centered on a cone (right photoreceptor with large pedicle), a rod (left photoreceptor with small spherule), and a narrow-field amacrine cell (bottom).E, Cone; F, G, cone bipolar cells;H, starburst amacrine cell. I–Q, Flat-mount images and computerized image reconstructions.I, Image (10×) of a retina flat mount revealing a ganglion cell (vertical arrow), a starburst amacrine cell (horizontal arrow), and a wide field amacrine cell (arrow at 45°). Mueller glia, bipolar, and narrow field amacrine cells are also seen in this plane of focus. In flat mounts, most of the abundant and highly compact cells either traverse the full thickness of the retina (Mueller glia) or are confined to the photoreceptor layer (rods and cones). J, Image (40×) of the starburst amacrine cell shown in I and its reconstructed image (K). The neurites of this cell were distributed in a narrow plane of ∼4 μm thickness.L–P, Successive focal planes through the ganglion cell in I and its reconstructed image (Q).
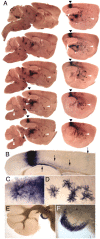
Fig. 3.
Morphology of adult CNS neurons. Brain from an adult R26CreER/+;ZAP/+ mouse that received a single intraperitoneal injection of 0.8 mg of 4HT at P21. A, Parasagittal section (300 μm) through the brain. Most of the intensely labeled cells are glia. B, Section (300 μm) through cortex (top) and hippocampus (center) reveals labeled pyramidal neurons (horizontal arrows) and CA1 neurons (vertical arrows). C–H, Successive focal planes through one of the CA1 neurons shown in_B_. I–M, Successive focal planes through a pyramidal neuron and its reconstructed image (N). O–Q, Three cerebellar granule cells. The cell bodies and compact dendritic trees are seen in the bottom half of each panel; the characteristic T-shaped branching of the axon that gives rise to parallel fibers is seen in the top half of each panel. In C_–_Q, successive focal planes are at intervals of 5 μm.
Fig. 4.
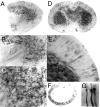
Morphology of brain and retinal neurons at E18. An R26CreER/R26CreER homozygous female was mated with a ZAP/+ male and injected at day 12 of gestation with 600 μg of 4HT. Embryos were harvested at E18. Parasagittal (A–C) and coronal (D, E) sections from two R26CreER/+;ZAP/+ littermates. B, C, The striatum at successively higher magnification showing fiber tracts (B) and individual axons originating from striatal neurons (C). E, Pyramidal neurons exhibit simple morphology, with unbranched apical dendrites and scarce basal dendrites; axons are seen descending to subcortical regions. F, G, Columnar arrangement of labeled cells within the retina. Cells within each vertical cluster of cells are likely to be clonally related.
Fig. 5.
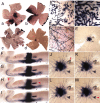
Genetically marked clones in the retina. R26CreER/R26CreER females were mated with ZAP/+ heterozygous males and injected with 1 μg/gm 4HT or 4 μg/gm 4HT at day 8 of gestation. Pregnancies were carried to term, and retinas from the progeny were analyzed in adulthood and viewed as flat mounts (A–E, J–M) or vertically sectioned at a thickness of ∼500 μm (F–I). A, Retinas_a–c_ are from 4 μg/gm 4HT injections; retina_d_ is from a 1 μg/gm 4HT injection. Retina_a_ has both neuronal/glial and vascular clones, retinas_b_ and d have only neuronal/glial clones, and retina c has only vascular clones. B, C, Progressively higher magnification views of blood vessels from retina c. D, Higher magnification view of retina b on the side of the retina distal to the labeled cell bodies; long dendritic processes are well labeled and extend across the entire retina. E, Higher magnification view of the single clone in retina d. The fibers with the greatest lateral extent are likely to originate from wide-field amacrine cells. Vertical sections (F–I) and flat mounts (J–M) of the clone in retina d at successive focal planes are shown. Two different horizontal cell arbors are indicated by horizontal arrowheads in H and M, and ganglion cell axons entering the optic nerve are indicated by_vertical arrowheads_ in H and_J_. F–I also show that within this clone the labeled cell bodies are tightly clustered and occupy a cross-sectional area far smaller that that occupied by the cell processes seen in the flat mount.
Fig. 6.
Embryonic clones visualized in the adult brain. Adult brain from a R26CreER/+;ZAP/+ mouse that had been exposed at E8 to a maternal injection of 1 μg/gm 4HT, as described in the legend of Figure 5. A, Consecutive 250 μm parasagittal sections, arrayed from medial (top left) to lateral (bottom right). In the cortex, a single contiguous cluster of stained cells is indicated by arrowheads and shown at higher magnification in B. One group of fibers from this clone descends to the external capsule (B, upward arrow); a second group of fibers targets adjacent regions of cortex (B, downward arrows). At the edge of the clone, individual interneurons can be resolved from the mass of labeled cells (C). The striatum (A, leftward arrowheads) has a single morphologic class of labeled interneurons, shown at higher magnification in D. Examination of the striatum at high magnification shows that each labeled cell has, in addition to numerous thick dendritic processes, a single thin axon that either passes out of the plane of section or terminates tens to hundreds of micrometers away in a halo of fine arbors. This morphology identifies these cells as neurons rather than glia. The dense labeling of the thalamus (A,rightward arrowhead) is derived primarily from neurites; few labeled cell bodies are seen. Densely stained fibers and cell bodies are seen in the dorsal cochlear nucleus (A,vertical arrowheads), shown at progressively higher magnifications in E and F.
Fig. 7.
Effect of 4HT injection time on the composition and size of labeled clones. Matings were performed as for Figure 5, except some of the progeny are additionally heterozygous for knock-out alleles either of frizzled3 or of frizzled4, neither of which appears to affect development in the heterozygous state (Wang et al., 2001,2002). A–C, Coronal sections of E18 embryos exposed to a maternal injection of 200 μg of 4HT on days 7 (A), 11 (B), or 13 (C) of gestation. In A, interhemispheric fibers from the anterior commissure (bottom) and corpus callosum (top) can be seen in the right hemisphere. A large cluster of labeled muscle fibers is apparent on the right side of the head.D–F, Clusters of AP+ cortical cells from E18 embryos exposed to a maternal injection of 200 μg of 4HT on days 10 (D), 11 (E), or 13 (F) of gestation. Compare this with Figure 4, which shows an E18 embryo that was exposed to a maternal injection of 400 μg of 4HT on day 12 of gestation. G, H, Coronal sections of E14 embryos exposed to a maternal injection of 200 μg of 4HT on day 8 (G) or 9 (H). I–L, Horizontal section of an adult brain exposed to a maternal injection of 200 μg of 4HT on day 13 of gestation; higher magnification view of cortex (J), olfactory bulb (K), and cerebellum (L). L, Large numbers of closely apposed parallel fibers from AP+ cerebellar granule cells in one of the regions that is heavily labeled. Compare this with Figure 3, which shows the adult brain from a mouse that was injected with 800 μg of 4HT on P21.
Similar articles
- Temporal control of gene recombination in astrocytes by transgenic expression of the tamoxifen-inducible DNA recombinase variant CreERT2.
Hirrlinger PG, Scheller A, Braun C, Hirrlinger J, Kirchhoff F. Hirrlinger PG, et al. Glia. 2006 Jul;54(1):11-20. doi: 10.1002/glia.20342. Glia. 2006. PMID: 16575885 - New mouse lines for the analysis of neuronal morphology using CreER(T)/loxP-directed sparse labeling.
Badea TC, Hua ZL, Smallwood PM, Williams J, Rotolo T, Ye X, Nathans J. Badea TC, et al. PLoS One. 2009 Nov 16;4(11):e7859. doi: 10.1371/journal.pone.0007859. PLoS One. 2009. PMID: 19924248 Free PMC article. - Temporally controlled site-specific mutagenesis in the germ cell lineage of the mouse testis.
Weber P, Schuler M, Gérard C, Mark M, Metzger D, Chambon P. Weber P, et al. Biol Reprod. 2003 Feb;68(2):553-9. doi: 10.1095/biolreprod.102.005801. Biol Reprod. 2003. PMID: 12533419 - The magical touch: genome targeting in epidermal stem cells induced by tamoxifen application to mouse skin.
Vasioukhin V, Degenstein L, Wise B, Fuchs E. Vasioukhin V, et al. Proc Natl Acad Sci U S A. 1999 Jul 20;96(15):8551-6. doi: 10.1073/pnas.96.15.8551. Proc Natl Acad Sci U S A. 1999. PMID: 10411913 Free PMC article. - Temporally regulated and tissue-specific gene manipulations in the adult and embryonic heart using a tamoxifen-inducible Cre protein.
Sohal DS, Nghiem M, Crackower MA, Witt SA, Kimball TR, Tymitz KM, Penninger JM, Molkentin JD. Sohal DS, et al. Circ Res. 2001 Jul 6;89(1):20-5. doi: 10.1161/hh1301.092687. Circ Res. 2001. PMID: 11440973
Cited by
- The transcription factor Myc controls metabolic reprogramming upon T lymphocyte activation.
Wang R, Dillon CP, Shi LZ, Milasta S, Carter R, Finkelstein D, McCormick LL, Fitzgerald P, Chi H, Munger J, Green DR. Wang R, et al. Immunity. 2011 Dec 23;35(6):871-82. doi: 10.1016/j.immuni.2011.09.021. Immunity. 2011. PMID: 22195744 Free PMC article. - Inhibitor of NF-kappa B kinases alpha and beta are both essential for high mobility group box 1-mediated chemotaxis [corrected].
Penzo M, Molteni R, Suda T, Samaniego S, Raucci A, Habiel DM, Miller F, Jiang HP, Li J, Pardi R, Palumbo R, Olivotto E, Kew RR, Bianchi ME, Marcu KB. Penzo M, et al. J Immunol. 2010 Apr 15;184(8):4497-509. doi: 10.4049/jimmunol.0903131. Epub 2010 Mar 15. J Immunol. 2010. PMID: 20231695 Free PMC article. - Single-cell transcriptomics identifies potential cells of origin of MYC rhabdoid tumors.
Graf M, Interlandi M, Moreno N, Holdhof D, Göbel C, Melcher V, Mertins J, Albert TK, Kastrati D, Alfert A, Holsten T, de Faria F, Meisterernst M, Rossig C, Warmuth-Metz M, Nowak J, Meyer Zu Hörste G, Mayère C, Nef S, Johann P, Frühwald MC, Dugas M, Schüller U, Kerl K. Graf M, et al. Nat Commun. 2022 Mar 22;13(1):1544. doi: 10.1038/s41467-022-29152-4. Nat Commun. 2022. PMID: 35318328 Free PMC article. - Photoentrainment and pupillary light reflex are mediated by distinct populations of ipRGCs.
Chen SK, Badea TC, Hattar S. Chen SK, et al. Nature. 2011 Jul 17;476(7358):92-5. doi: 10.1038/nature10206. Nature. 2011. PMID: 21765429 Free PMC article. - cBAF complex components and MYC cooperate early in CD8+ T cell fate.
Guo A, Huang H, Zhu Z, Chen MJ, Shi H, Yuan S, Sharma P, Connelly JP, Liedmann S, Dhungana Y, Li Z, Haydar D, Yang M, Beere H, Yustein JT, DeRenzo C, Pruett-Miller SM, Crawford JC, Krenciute G, Roberts CWM, Chi H, Green DR. Guo A, et al. Nature. 2022 Jul;607(7917):135-141. doi: 10.1038/s41586-022-04849-0. Epub 2022 Jun 22. Nature. 2022. PMID: 35732731 Free PMC article.
References
- Bayer SA, Altman J. Neurogenesis and neuronal migration. In: Paxinos G, editor. The rat nervous system. Academic; San Diego: 1995. pp. 1041–1078.
- Burns AJ, Le Douarin NM. Enteric nervous system development: analysis of the selective developmental potentialities of vagal and sacral neural crest cells using quail-chick chimeras. Anat Rec. 2001;262:16–28. - PubMed
- Cepko CL, Fields-Berry S, Ryder E, Austin C, Golden J. Lineage analysis using retroviral vectors. Curr Top Dev Biol. 1998;36:51–74. - PubMed
- Danielian PS, Muccino D, Rowitch DH, Michael SK, McMahon AP. Modification of gene activity in mouse embryos in utero by a tamoxifen-inducible form of Cre recombinase. Curr Biol. 1998;8:1323–1326. - PubMed
Publication types
MeSH terms
Substances
LinkOut - more resources
Full Text Sources
Other Literature Sources
Molecular Biology Databases
Research Materials
