Genome-wide analysis of mRNA translation profiles in Saccharomyces cerevisiae - PubMed (original) (raw)
Genome-wide analysis of mRNA translation profiles in Saccharomyces cerevisiae
Yoav Arava et al. Proc Natl Acad Sci U S A. 2003.
Abstract
We have analyzed the translational status of each mRNA in rapidly growing Saccharomyces cerevisiae. mRNAs were separated by velocity sedimentation on a sucrose gradient, and 14 fractions across the gradient were analyzed by quantitative microarray analysis, providing a profile of ribosome association with mRNAs for thousands of genes. For most genes, the majority of mRNA molecules were associated with ribosomes and presumably engaged in translation. This systematic approach enabled us to recognize genes with unusual behavior. For 43 genes, most mRNA molecules were not associated with ribosomes, suggesting that they may be translationally controlled. For 53 genes, including GCN4, CPA1, and ICY2, three genes for which translational control is known to play a key role in regulation, most mRNA molecules were associated with a single ribosome. The number of ribosomes associated with mRNAs increased with increasing length of the putative protein-coding sequence, consistent with longer transit times for ribosomes translating longer coding sequences. The density at which ribosomes were distributed on each mRNA (i.e., the number of ribosomes per unit ORF length) was well below the maximum packing density for nearly all mRNAs, consistent with initiation as the rate-limiting step in translation. Global analysis revealed an unexpected correlation: Ribosome density decreases with increasing ORF length. Models to account for this surprising observation are discussed.
Figures
Figure 1
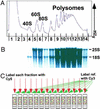
Obtaining polysome profiles by microarray analysis. (A) Representative absorbance profile for RNA separated by velocity sedimentation through a 10–50% sucrose gradient (see Materials and Methods). The positions of the 40S, 60S, 80S, and polysomal peaks are indicated. The expected peaks for the tRNAs and other small RNAs in fractions 1 and 2 are obscured by the high absorbance, presumably from proteins and detergent used in the preparation. (B) RNA was extracted from each of the 14 fractions, and an aliquot from each fraction was subjected to electrophoresis through a formaldehyde gel, transferred to a nylon membrane, and stained with methylene blue. As expected, 25S and 18S ribosomal RNAs were the prominent species (markers not shown). (C) RNA aliquots from each fraction were reverse-transcribed to incorporate Cy5-dUTP, and a common reference (unfractionated RNA) was reverse-transcribed in the presence of Cy3-dUTP. The resulting labeled cDNAs from each fraction and the common reference were mixed and then hybridized to a DNA microarray containing all yeast ORFs, as predicted from the genome sequence (Saccharomyces Genome Database). Known concentrations of B. subtilis mRNAs were added to each sample immediately at collection to allow normalization of RNA levels and comparison between fractions (see Materials and Methods).
Figure 2
(A) Polysomal profiles from DNA microarray analysis and Northern blots. (Upper) Profiles obtained from the microarray analysis. (Lower) Profiles from Northern blots. For each gene, the sample intensity in each fraction has been color-coded and aligned horizontally (color scale shown below). Gray squares represent values that did not pass the quality selection criteria; to allow normalization these fractions were assigned to have the averaged intensity of their neighbors. For PMA1, fractions 1–5 were not analyzed by Northern blot. ORF length is indicated below each gene. (B) Sample polysomal profiles from triplicate DNA microarray analyses. The smaller symbols represent data from individual experiments, and the blue diamonds connected by a line are the average values for each fraction. The percentage of total mRNA for the given gene in a given fraction is plotted. Black numbers on the x axis are the fraction numbers, and the red numbers indicate the number of bound ribosomes. Ribosome occupancy and ribosome density values (see Discussion) are indicated for each gene. Analogous plots for all genes are available at our web site.
Figure 3
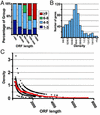
Number and density of ribosomes associated with mRNAs. (A) The selected 739 genes (see Results) were grouped according to ORF length. Each group contained at least 85 genes. For each length group, the fraction of genes in that group containing one to three ribosomes (dark blue), four to five ribosomes (light blue), six to eight ribosomes (green), and nine or more ribosomes (red) is shown. (B) The number of genes as a function of ribosome density (average = 0.64 ± 0.31 ribosomes per 100 nts). (C) Ribosome density as a function of ORF length (open circles). The red line indicates moving average density value (window of 50). The ordering of the density values (open circles) in apparent hyperbolic curves arises, because the ORF lengths are divided by quantized values (whole number of ribosomes).
Similar articles
- Dissecting eukaryotic translation and its control by ribosome density mapping.
Arava Y, Boas FE, Brown PO, Herschlag D. Arava Y, et al. Nucleic Acids Res. 2005 Apr 28;33(8):2421-32. doi: 10.1093/nar/gki331. Print 2005. Nucleic Acids Res. 2005. PMID: 15860778 Free PMC article. - Novel mRNA-specific effects of ribosome drop-off on translation rate and polysome profile.
Bonnin P, Kern N, Young NT, Stansfield I, Romano MC. Bonnin P, et al. PLoS Comput Biol. 2017 May 30;13(5):e1005555. doi: 10.1371/journal.pcbi.1005555. eCollection 2017 May. PLoS Comput Biol. 2017. PMID: 28558053 Free PMC article. - Co-translational mRNA decay in Saccharomyces cerevisiae.
Hu W, Sweet TJ, Chamnongpol S, Baker KE, Coller J. Hu W, et al. Nature. 2009 Sep 10;461(7261):225-9. doi: 10.1038/nature08265. Epub 2009 Aug 23. Nature. 2009. PMID: 19701183 Free PMC article. - Translatome profiling: methods for genome-scale analysis of mRNA translation.
King HA, Gerber AP. King HA, et al. Brief Funct Genomics. 2016 Jan;15(1):22-31. doi: 10.1093/bfgp/elu045. Epub 2014 Nov 6. Brief Funct Genomics. 2016. PMID: 25380596 Review. - Translational regulation in response to stress in Saccharomyces cerevisiae.
Crawford RA, Pavitt GD. Crawford RA, et al. Yeast. 2019 Jan;36(1):5-21. doi: 10.1002/yea.3349. Epub 2018 Sep 3. Yeast. 2019. PMID: 30019452 Free PMC article. Review.
Cited by
- Current limitations in predicting mRNA translation with deep learning models.
Schlusser N, González A, Pandey M, Zavolan M. Schlusser N, et al. Genome Biol. 2024 Aug 20;25(1):227. doi: 10.1186/s13059-024-03369-6. Genome Biol. 2024. PMID: 39164757 Free PMC article. - Respiratory Syncytial Virus (RSV) optimizes the translational landscape during infection.
Kerkhofs K, Guydosh NR, Bayfield MA. Kerkhofs K, et al. bioRxiv [Preprint]. 2024 Aug 3:2024.08.02.606199. doi: 10.1101/2024.08.02.606199. bioRxiv. 2024. PMID: 39131278 Free PMC article. Preprint. - Polysome collapse and RNA condensation fluidize the cytoplasm.
Xie Y, Shu T, Liu T, Spindler MC, Mahamid J, Hocky GM, Gresham D, Holt LJ. Xie Y, et al. Mol Cell. 2024 Jul 25;84(14):2698-2716.e9. doi: 10.1016/j.molcel.2024.06.024. Mol Cell. 2024. PMID: 39059370 - Enrichment of rare codons at 5' ends of genes is a spandrel caused by evolutionary sequence turnover and does not improve translation.
Sejour R, Leatherwood J, Yurovsky A, Futcher B. Sejour R, et al. Elife. 2024 Jul 15;12:RP89656. doi: 10.7554/eLife.89656. Elife. 2024. PMID: 39008347 Free PMC article. - Transcriptome-wide mRNA condensation precedes stress granule formation and excludes stress-induced transcripts.
Glauninger H, Bard JAM, Wong Hickernell CJ, Airoldi EM, Li W, Singer RH, Paul S, Fei J, Sosnick TR, Wallace EWJ, Drummond DA. Glauninger H, et al. bioRxiv [Preprint]. 2024 May 2:2024.04.15.589678. doi: 10.1101/2024.04.15.589678. bioRxiv. 2024. PMID: 38659805 Free PMC article. Preprint.
References
- Hughes T R, Marton M J, Jones A R, Roberts C J, Stoughton R, Armour C D, Bennett H A, Coffey E, Dai H, He Y D, et al. Cell. 2000;102:109–126. - PubMed
- Holstege F C, Jennings E G, Wyrick J J, Lee T I, Hengartner C J, Green M R, Golub T R, Lander E S, Young R A. Cell. 1998;95:717–728. - PubMed
- DeRisi J L, Iyer V R, Brown P O. Science. 1997;278:680–686. - PubMed
- Winzeler E A, Shoemaker D D, Astromoff A, Liang H, Anderson K, Andre B, Bangham R, Benito R, Boeke J D, Bussey H, et al. Science. 1999;285:901–906. - PubMed
Publication types
MeSH terms
Substances
LinkOut - more resources
Full Text Sources
Other Literature Sources
Molecular Biology Databases


