Combined deficiency of p50 and cRel in CD4+ T cells reveals an essential requirement for nuclear factor kappaB in regulating mature T cell survival and in vivo function - PubMed (original) (raw)
Combined deficiency of p50 and cRel in CD4+ T cells reveals an essential requirement for nuclear factor kappaB in regulating mature T cell survival and in vivo function
Ye Zheng et al. J Exp Med. 2003.
Abstract
Signaling pathways involved in regulating T cell proliferation and survival are not well understood. Here we have investigated a possible role of the nuclear factor (NF)-kappaB pathway in regulating mature T cell function by using CD4+ T cells from p50-/- cRel-/- mice, which exhibit virtually no inducible kappaB site binding activity. Studies with these mice indicate an essential role of T cell receptor (TCR)-induced NF-kappaB in regulating interleukin (IL)-2 expression, cell cycle entry, and survival of T cells. Our results further indicate that NF-kappaB regulates TCR-induced expression of antiapoptotic Bcl-2 family members. Strikingly, retroviral transduction of CD4+ T cells with the NF-kappaB-inducing IkappaB kinase beta showed that NF-kappaB activation is not only necessary but also sufficient for T cell survival. In contrast, our results indicate a lack of involvement of NF-kappaB in both IL-2 and Akt-induced survival pathways. In vivo, p50-/- cRel-/- mice showed impaired superantigen-induced T cell responses as well as decreased numbers of effector/memory and regulatory CD4+ T cells. These findings provide the first demonstration of a role for NF-kappaB proteins in regulating T cell function in vivo and establish a critically important function of NF-kappaB in TCR-induced regulation of survival.
Figures
Figure 1.
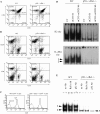
Combined absence of p50 and cRel NF-κB subunits does not affect T cell development. (A) FACS® analysis of CD4 and CD8 expression in WT and p50−/− cRel−/− thymocytes. (B) FACS® analysis of B220, CD3, CD4, and CD8 expression in WT and p50−/− cRel−/− splenocytes. (C) CD3 expression level in WT and p50−/− cRel−/− CD4+ T cells. FACS® was performed by gating on CD4+ cells. (D) EMSAs were performed with nuclear extracts from naive CD4+ T cells either untreated or activated with 1 μg/ml plate-bound αCD3 or 1 μg/ml plate-bound αCD3 plus 1 μg/ml αCD28 for 6 h. NF-κB binding sites used were from H-2K_b_and IL-Rα (CD25). Complexes 1 and 2 are described in the text. (E) EMSAs were performed with nuclear extracts from naive CD4+ T cells activated with 1 μg/ml plate-bound αCD3 plus 1 μg/ml αCD28 for 6 h. NF-κB binding site was from H-2K_b_. The addition of antibodies to RelA and p100/p52 is indicated.
Figure 2.
Impaired cell cycle entry and survival after TCR stimulation of p50−/− cRel−/− T cells. (A) WT and p50−/− cRel−/− CD4+ T cells were activated with plate-bound αCD3, αCD3+IL-2, αCD3+αCD28, or αCD3+ αCD28+IL-2 for 2 d before DNA content staining and FACS® were performed. The percentages show the sub-G0 population, which represents apoptotic cells and cells in different phases of the cell cycle. Typical results of several independent experiments are shown. (B) RT-PCR was performed to determine expression of IL-2, c-Myc, Bcl2, and Bcl-XL in WT and p50−/− cRel−/− CD4+ T cells after 6 h of activation.
Figure 3.
Impaired cell division of p50−/− cRel−/− CD4+ T cells after activation. (A and B) WT and p50−/− cRel−/− CD4+ T cells were CFSE labeled and activated under different conditions as shown for 1–3 d. FACS® was performed on viable cells by gating on the forward and side scatter characteristics. As shown in the bottom right of B, peaks/shoulders represent the number of times cells underwent division. The percentage indicates cell population that has divided at least once. (C) FACS® analysis of CD25 (IL-2Rα) expression on WT and p50−/− cRel−/− CD4+ T cells after 3 d of activation by plate-bound αCD3+αCD28 and IL-2.
Figure 4.
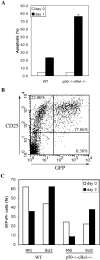
High susceptibility of activated p50−/− cRel−/− T cells to cell death can be rescued by Bcl-2. (A) WT and p50−/− cRel−/− CD4+ T cells were activated by plate-coated αCD3+αCD28 for 3 d after which dead cells were removed on a Ficoll gradient. These cells were either stained with PE-αCD25 and SYTOX immediately (day 0) or cultured in T cell medium without αCD3 or IL-2 for 24 h before PE-αCD25 and SYTOX staining (day 1). Apoptosis rate represent the percentage of CD25+ SYTOX+ cells (apoptotic) in the total CD25+ population. (B) p50−/− cRel−/− CD4+ T cells were infected with MIG retrovirus during a 4-d stimulation in the presence of αCD3+ αCD28. On day 4, viable cells were stained by αCD25 before FACS® analysis. (C) MIG and Bcl2 retroviral-infected WT and p50−/− cRel−/− CD4+ T cells were obtained as described in B, and either stained with PI and analyzed by FACS® immediately (day 0) or cultured in T cell medium without αCD3 or IL-2 for 2 d before PI staining and FACS® (day 2). The viable infected cells were GFP+ PI−. The percentage was calculated based on the percentage of GFP+ PI− cells in the total cell population. The increase in the percentage of Bcl-2–infected cells after 2 d in this experiment is likely due to the decrease in the number of uninfected cells because of cell death, rather than an increase in the absolute number of Bcl-2–infected cells.
Figure 5.
IL-2–induced survival pathway does not require p50+cRel. αCD3+αCD28–activated WT and p50−/− cRel−/− CD4+ T cells were cultured in T cell medium alone or in the presence of 20 ng/ml IL-2 for 1 or 2 d. Cell death was determined by DNA content staining and sub-G0 quantification.
Figure 6.
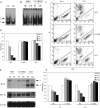
NF-κB activation is sufficient to promote T cell survival. (A) αCD3+αCD28+IL-2–activated WT CD4+ T cells were either used to make nuclear extract immediately or cultured in T cell medium without stimulation for 12 h before nuclear extract was made. EMSA was performed with an H2 site probe. The two complexes are described in the text. (B) MIG and CA-IKKβ retrovirus-infected WT CD4+ T cells were used immediately (0 h) or cultured in T cell medium without stimulation for 12 h. Nuclear extracts were made and EMSA was performed with the H2 site probe. (C and D) MIG, CA-IKKβ, and Bcl2 retrovirus-infected WT T cells were cultured in T cell medium without stimulation for 0, 1, 2, or 3 d, after which cells were stained with PI and analyzed by FACS®. FACS® data on days 0 and 3 are shown in C. The percentage indicates the proportion of GFP+ PI− cells in total cell population. The percentage survival of infected T cells from days 0 to 3 are shown in D. (E) MIG, CA-IKKβ, and Bcl2 retroviral-infected WT T cells were cultured in T cell medium without αCD3 or IL-2 for 12 h. RNA was extracted before and after culturing. Bcl2, Bcl-XL, and β actin expression was examined by Northern blotting. 1, endogenously expressed Bcl2; 2, ectopically expressed Bcl2. (F) MIG, CA-IKKβ retrovirus-infected OT-II×IL-2+/+ and OT-II×IL-2−/− T cells were cultured in T cell medium without stimulation for 0–3 d. Survival rate of the infected cells was determined by PI staining and FACS® analysis as in C and D.
Figure 7.
Lack of involvement of p50+cRel in Akt-induced T cell survival. MIG, myr-AKT, and CA-IKKβ retrovirus-infected WT and p50−/− cRel−/− CD4+ T cells were cultured in T cell medium without αCD3 or IL-2 for 1 or 2 d. Survival rate of the infected cells was determined by PI staining and FACS® analysis as in Fig. 6, C and D.
Figure 8.
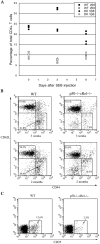
Impaired antigen-induced responses and effector/memory and regulatory T cell generation in WT and p50−/− cRel−/− mice. (A) WT and p50−/− cRel−/− mice were either uninjected (day 0) or injected with SEB. Vβ8+ and Vβ6+ T cell populations were determined 3 and 6 d after injection. Two mice of each genotype were used per condition. (B) Naive and memory T cell populations were determined using 3- and 8-wk-old WT and p50−/− cRel−/− mice. Splenocytes from these mice were stained with CD4, CD44, and CD62L antibodies. FACS® analysis was performed on gated CD4+ T cells. Naive T cells were CD44low CD62L+ and memory T cells were CD44high CD62L−. (C) Splenocytes from 2-mo-old WT and p50−/− cRel−/− mice were stained with CD4 and CD25. FACS® analysis was performed on gated CD4+ T cells.
Similar articles
- Antiapoptotic function of NF-kappaB in T lymphocytes is influenced by their differentiation status: roles of Fas, c-FLIP, and Bcl-xL.
Mora AL, Corn RA, Stanic AK, Goenka S, Aronica M, Stanley S, Ballard DW, Joyce S, Boothby M. Mora AL, et al. Cell Death Differ. 2003 Sep;10(9):1032-44. doi: 10.1038/sj.cdd.4401257. Cell Death Differ. 2003. PMID: 12934078 - NF-kappa B RelA (p65) is essential for TNF-alpha-induced fas expression but dispensable for both TCR-induced expression and activation-induced cell death.
Zheng Y, Ouaaz F, Bruzzo P, Singh V, Gerondakis S, Beg AA. Zheng Y, et al. J Immunol. 2001 Apr 15;166(8):4949-57. doi: 10.4049/jimmunol.166.8.4949. J Immunol. 2001. PMID: 11290773 - Molecular profiling of the role of the NF-kappaB family of transcription factors during alloimmunity.
Finn PW, He H, Ma C, Mueller T, Stone JR, Liou HC, Boothby MR, Perkins DL. Finn PW, et al. J Leukoc Biol. 2002 Nov;72(5):1054-62. J Leukoc Biol. 2002. PMID: 12429729 - Regulation and function of IKK and IKK-related kinases.
Häcker H, Karin M. Häcker H, et al. Sci STKE. 2006 Oct 17;2006(357):re13. doi: 10.1126/stke.3572006re13. Sci STKE. 2006. PMID: 17047224 Review. - [The Rel/NF-kappa-B transcription factors: complex role in cell regulation].
Bottex-Gauthier C, Pollet S, Favier A, Vidal DR. Bottex-Gauthier C, et al. Pathol Biol (Paris). 2002 Apr;50(3):204-11. doi: 10.1016/s0369-8114(02)00289-4. Pathol Biol (Paris). 2002. PMID: 11980335 Review. French.
Cited by
- Spaceflight and simulated microgravity cause a significant reduction of key gene expression in early T-cell activation.
Martinez EM, Yoshida MC, Candelario TL, Hughes-Fulford M. Martinez EM, et al. Am J Physiol Regul Integr Comp Physiol. 2015 Mar 15;308(6):R480-8. doi: 10.1152/ajpregu.00449.2014. Epub 2015 Jan 7. Am J Physiol Regul Integr Comp Physiol. 2015. PMID: 25568077 Free PMC article. - Toll-like receptor ligands directly promote activated CD4+ T cell survival.
Gelman AE, Zhang J, Choi Y, Turka LA. Gelman AE, et al. J Immunol. 2004 May 15;172(10):6065-73. doi: 10.4049/jimmunol.172.10.6065. J Immunol. 2004. PMID: 15128790 Free PMC article. - Apigenin, a dietary flavonoid, sensitizes human T cells for activation-induced cell death by inhibiting PKB/Akt and NF-kappaB activation pathway.
Xu L, Zhang L, Bertucci AM, Pope RM, Datta SK. Xu L, et al. Immunol Lett. 2008 Nov 16;121(1):74-83. doi: 10.1016/j.imlet.2008.08.004. Epub 2008 Sep 21. Immunol Lett. 2008. PMID: 18812189 Free PMC article. - Targeted deletion of HIF-1alpha gene in T cells prevents their inhibition in hypoxic inflamed tissues and improves septic mice survival.
Thiel M, Caldwell CC, Kreth S, Kuboki S, Chen P, Smith P, Ohta A, Lentsch AB, Lukashev D, Sitkovsky MV. Thiel M, et al. PLoS One. 2007 Sep 5;2(9):e853. doi: 10.1371/journal.pone.0000853. PLoS One. 2007. PMID: 17786224 Free PMC article. - Doxycycline is an NF-κB inhibitor that induces apoptotic cell death in malignant T-cells.
Alexander-Savino CV, Hayden MS, Richardson C, Zhao J, Poligone B. Alexander-Savino CV, et al. Oncotarget. 2016 Nov 15;7(46):75954-75967. doi: 10.18632/oncotarget.12488. Oncotarget. 2016. PMID: 27732942 Free PMC article.
References
- Kane, L.P., J. Lin, and A. Weiss. 2000. Signal transduction by the TCR for antigen. Curr. Opin. Immunol. 12:242–249. - PubMed
- Jenkins, M.K., A. Khoruts, E. Ingulli, D.L. Mueller, S.J. McSorley, R.L. Reinhardt, A. Itano, and K.A. Pape. 2001. In vivo activation of antigen-specific CD4 T cells. Annu. Rev. Immunol. 19:23–45. - PubMed
- Van Parijs, L., and A.K. Abbas. 1998. Homeostasis and self-tolerance in the immune system: turning lymphocytes off. Science. 280:243–248. - PubMed
- Lenardo, M., K.M. Chan, F. Hornung, H. McFarland, R. Siegel, J. Wang, and L. Zheng. 1999. Mature T lymphocyte apoptosis-immune regulation in a dynamic and unpredictable antigenic environment. Annu. Rev. Immunol. 17:221–253. - PubMed
Publication types
MeSH terms
Substances
LinkOut - more resources
Full Text Sources
Other Literature Sources
Research Materials


