CCR10 expression is a common feature of circulating and mucosal epithelial tissue IgA Ab-secreting cells - PubMed (original) (raw)
CCR10 expression is a common feature of circulating and mucosal epithelial tissue IgA Ab-secreting cells
Eric J Kunkel et al. J Clin Invest. 2003 Apr.
Abstract
The dissemination of IgA-dependent immunity between mucosal sites has important implications for mucosal immunoprotection and vaccine development. Epithelial cells in diverse gastrointestinal and nonintestinal mucosal tissues express the chemokine MEC/CCL28. Here we demonstrate that CCR10, a receptor for MEC, is selectively expressed by IgA Ab-secreting cells (large s/cIgA(+)CD38(hi)CD19(int/-)CD20(-)), including circulating IgA(+) plasmablasts and almost all IgA(+) plasma cells in the salivary gland, small intestine, large intestine, appendix, and tonsils. Few T cells in any mucosal tissue examined express CCR10. Moreover, tonsil IgA plasmablasts migrate to MEC, consistent with the selectivity of CCR10 expression. In contrast, CCR9, whose ligand TECK/CCL25 is predominantly restricted to the small intestine and thymus, is expressed by a fraction of IgA Ab-secreting cells and almost all T cells in the small intestine, but by only a small percentage of plasma cells and plasmablasts in other sites. These results point to a unifying role for CCR10 and its mucosal epithelial ligand MEC in the migration of circulating IgA plasmablasts and, together with other tissue-specific homing mechanisms, provides a mechanistic basis for the specific dissemination of IgA Ab-secreting cells after local immunization.
Figures
Figure 1
CCR10 is expressed on few gastrointestinal tissue T lymphocytes. (a) Frozen sections of epithelial tissues were costained with Ab’s against CD3 (T cells; green), CCR10 (red), and CD20 (naive, memory, and GC B cells; blue). The lack of coexpression of CCR10 with CD3 or CD20 demonstrates that the cells expressing CCR10 within these tissues are not memory T or B cells. (b) T lymphocytes from various segments of the gastrointestinal tract and the tonsil were isolated and stained for CD4+ or CD8+ (and the marker CD45RA) in conjunction with CCR10 or CCR9. CCR10 is virtually absent on T cells within these tissues (<5% CCR10+ T cells in any examined tissue), while CCR9 is expressed on almost all T cells from the small intestine (85% ± 11% in the jejunum and 87% ± 9% in the ileum), and a subpopulation of T cells in the colon (15% ± 8%) and stomach (11% ± 6%), as described (14). Immunohistochemistry data is representative of three salivary gland, five jejunum, three ileum, two duodenum, four colon, and three appendix samples (and three tonsil and three stomach samples that are not shown). Flow-cytometry data are representative of two tonsil, three stomach, three jejunum, three ileum, three colon, and two appendix samples with mean ± SD shown. Percentage of CCR10- or CCR9-positive cells based on quadrant encompassing 3% of isotype control-stained cells in dot blots.
Figure 2
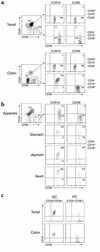
CCR10 is expressed on mucosal tissue lymphocytes with a PC phenotype. Lymphocytes isolated from the gastrointestinal tract or tonsil were stained for CD19, CD20, and CD38 to define various B cell subsets (gated on large lymphocytes by scatter). (a) Both the colon and tonsil contained significant populations of both GC (CD38+CD19+CD20hi) and PC (CD38hiCD19+/–CD20–) phenotype B cells. GC cells did not express either CCR10 or CCR9 (<3% of GC cells in all tissues examined), while a fraction of PCs in the tonsil (22% ± 4%) and virtually all PCs in the colon (92% ± 4%) expressed CCR10. (**b**) CCR10 was also expressed on the vast majority of PCs in the jejunum (90% ± 7%), ileum (92% ± 5%), and stomach (87% ± 10%), and a significant fraction of cells in the appendix (38% ± 11%). CCR9 was present on PCs in the jejunum (36% ± 14%) and ileum (41% ± 18%) where TECK is also expressed and on PCs in the stomach (13% ± 7%). (**c**) GC cells in both the tonsil and colon expressed high levels of CD19 (>95% positive), while the phenotypically defined PC in both tissues had largely downregulated CD19 (<15% positive). Flow-cytometry data are representative of two tonsil, three stomach, three jejunum, three ileum, three colon, and two appendix samples with mean ± SD shown. Percentage of CCR10- or CCR9-positive cells based on quadrant encompassing 5% of isotype control-stained cells in dot blots.
Figure 3
CCR10 is expressed by mucosal tissue IgA plasma cells. Epithelial tissues known to be sites of IgA plasma cell localization were costained for CCR10 (red) and IgA1/2 (green; in a and b) or IgG (green; panel c). (a) The expression pattern of IgA on colon lymphocytes is identical to that of CCR10. Because CCR10 is surface expressed and IgA can be both on the surface and intracellular, the merged panel includes regions of yellow overlap as well as green and red areas. (b) Merged images of CCR10 and IgA staining from other tissues containing IgA plasma cells demonstrate that CCR10 colocalizes with IgA in all sites examined. Luminally transported secretory IgA can be seen in the lumens of the duodenum, jejunum, and appendix. Insets show negative control staining. (c) A small fraction of IgG PCs are present in mucosal tissues, but CCR10 did not colocalize well with these cells. Immunohistochemistry data is representative of three salivary gland, three stomach, five jejunum, three ileum, two duodenum, five colon, and three appendix samples.
Figure 4
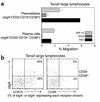
MEC is chemotactic for tonsil IgA plasmablasts expressing CCR10. (a) Tonsil lymphocytes were migrated to medium, SDF-1α (100 nM), TECK (300 nM), or MEC (300 nM) and stained for sIgA, CD19, CD20, and CD38 to identify plasmablasts and plasma cells in the large lymphocyte gate. Only sIgA+ B cells with a plasmablast phenotype migrated well to MEC. Plasmablasts did not migrate well to TECK. (b) Consistent with their migration to MEC, tonsil plasmablasts and plasma cells (CD38hiCD20–) express CCR10 (60% ± 14% of sIgA+ plasmablasts and 21% ± 13% of sIgAlo/– PCs), while the lack of a TECK response is consistent with the small number of cells expressing CCR9 (10% ± 6% of sIgA+ plasmablasts and 4% ± 2% of sIgAlo/– PCs). Data are representative of two independent experiments with multiple wells per experiment (the percentage of cells expressing CCR10 or CCR9 is averaged over both experiments, mean ± SD). As stated, the percentages shown in b are the percentages of sIgA+ or sIgA– plasma cells expressing each receptor. Background migration was <1% in both cell populations.
Figure 5
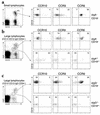
Subsets of circulating blood IgA plasmablasts express CCR10 and CCR9. Peripheral blood lymphocytes were isolated, depleted of T cells, and stained for surface IgA (sIgA) or surface IgG (sIgG), CD19, a dump cocktail (CD14, CD3, IgD, and CD94), and CCR10, CCR9, or CCR6. (a) Of small memory lymphocytes expressing sIgA (CD19+sIgA+; 4% ± 2% of total CD19+ cells), few expressed CCR10 (3% ± 2%), while a small population expressed CCR9 (16% ± 5%), and virtually all expressed CCR6 (98% ± 1%). (b) Two discernable populations of dump cocktail–negative lymphocytes in the large lymphocyte gate could be identified by expression of sIgA and CD19. Large lymphocytes with an IgA memory phenotype (sIgA+CD19+) expressed CCR10 (4% ± 1%), CCR9 (28% ± 3%), and CCR6 (90% ± 2%) in a pattern similar to small sIgA+ memory lymphocytes. A large fraction of lymphocytes with an IgA plasmablast phenotype (sIgAintCD19int; roughly 0.1% of total CD19+ cells) expressed CCR10 (72% ± 8%), and a smaller fraction expressed CCR9 (17% ± 13%), while few expressed CCR6 (13% ± 3%). (c) The majority (>90%) of sIgA-CD19+/int lymphocytes (shown in b by box) are sIgG+. IgG+ memory lymphocytes (sIgG+CD19+) did not express CCR10 (3% ± 2%), while some expressed CCR9 (14% ± 3%), and almost all expressed CCR6 (84% ± 6%). Plasmablasts expressing sIgG (sIgG+CD19int) contained some CCR10+ (13% ± 6%) and CCR9+ (16% ± 7%) lymphocytes and few CCR6+ (18% ± 4%) cells. Data are representative of four experiments from separate blood donors with data averaged across donors (mean ± SD).
Figure 6
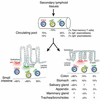
MEC and CCR10 unify the epithelial IgA immune system. After development in secondary lymphoid tissues (i.e., the tonsil or appendix), IgA plasma cells (PCs) expressing CCR10 or CCR9 enter the circulation. By virtue of the expression of both MEC and TECK in the small intestine, both CCR10+ and CCR9+ PCs can enter this tissue (although CCR10+ PCs predominate). In other tissues where MEC expression predominates (i.e., the colon and stomach), CCR10+ PCs predominate, and CCR9+ PCs are more rare. Other epithelial sites where MEC is expressed (i.e., the mammary gland and trachea/bronchioles) and IgA is secreted may also contain CCR10+ PCs. CCR9+ T cells (T) predominate in the small intestine where TECK is expressed and exist at lower levels in closely associated tissues such as the stomach and colon. This separate, previously described, T lymphocyte localization pathway for the small intestine (via CCR9/TECK) allows functional compartmentalization of this organ, while physically dispersed organs that all share the function of pathogen neutralization by IgA are unified by CCR10/MEC. Model includes data from refs. , , .
Similar articles
- Expression of TECK/CCL25 and MEC/CCL28 chemokines and their respective receptors CCR9 and CCR10 in porcine mucosal tissues.
Meurens F, Berri M, Whale J, Dybvig T, Strom S, Thompson D, Brownlie R, Townsend HG, Salmon H, Gerdts V. Meurens F, et al. Vet Immunol Immunopathol. 2006 Oct 15;113(3-4):313-27. doi: 10.1016/j.vetimm.2006.05.014. Epub 2006 Jul 12. Vet Immunol Immunopathol. 2006. PMID: 16839611 - CC chemokine ligands 25 and 28 play essential roles in intestinal extravasation of IgA antibody-secreting cells.
Hieshima K, Kawasaki Y, Hanamoto H, Nakayama T, Nagakubo D, Kanamaru A, Yoshie O. Hieshima K, et al. J Immunol. 2004 Sep 15;173(6):3668-75. doi: 10.4049/jimmunol.173.6.3668. J Immunol. 2004. PMID: 15356112 - A common mucosal chemokine (mucosae-associated epithelial chemokine/CCL28) selectively attracts IgA plasmablasts.
Lazarus NH, Kunkel EJ, Johnston B, Wilson E, Youngman KR, Butcher EC. Lazarus NH, et al. J Immunol. 2003 Apr 1;170(7):3799-805. doi: 10.4049/jimmunol.170.7.3799. J Immunol. 2003. PMID: 12646646 - CCR10 and its ligands in regulation of epithelial immunity and diseases.
Xiong N, Fu Y, Hu S, Xia M, Yang J. Xiong N, et al. Protein Cell. 2012 Aug;3(8):571-80. doi: 10.1007/s13238-012-2927-3. Epub 2012 Jun 8. Protein Cell. 2012. PMID: 22684736 Free PMC article. Review. - Chemokine receptors and leukocyte trafficking in the mucosal immune system.
Williams IR. Williams IR. Immunol Res. 2004;29(1-3):283-92. doi: 10.1385/IR:29:1-3:283. Immunol Res. 2004. PMID: 15181289 Review.
Cited by
- CCR10/CCL27 crosstalk contributes to failure of proteasome-inhibitors in multiple myeloma.
Thangavadivel S, Zelle-Rieser C, Olivier A, Postert B, Untergasser G, Kern J, Brunner A, Gunsilius E, Biedermann R, Hajek R, Pour L, Willenbacher W, Greil R, Jöhrer K. Thangavadivel S, et al. Oncotarget. 2016 Nov 29;7(48):78605-78618. doi: 10.18632/oncotarget.12522. Oncotarget. 2016. PMID: 27732933 Free PMC article. - Enzyme-linked immunospot assays for direct ex vivo measurement of vaccine-induced human humoral immune responses in blood.
Saletti G, Çuburu N, Yang JS, Dey A, Czerkinsky C. Saletti G, et al. Nat Protoc. 2013 Jun;8(6):1073-87. doi: 10.1038/nprot.2013.058. Epub 2013 May 9. Nat Protoc. 2013. PMID: 23660756 - Chemokine receptor CCR9 contributes to the localization of plasma cells to the small intestine.
Pabst O, Ohl L, Wendland M, Wurbel MA, Kremmer E, Malissen B, Förster R. Pabst O, et al. J Exp Med. 2004 Feb 2;199(3):411-6. doi: 10.1084/jem.20030996. Epub 2004 Jan 26. J Exp Med. 2004. PMID: 14744993 Free PMC article. - Systemic immunization with CCL27/CTACK modulates immune responses at mucosal sites in mice and macaques.
Kraynyak KA, Kutzler MA, Cisper NJ, Khan AS, Draghia-Akli R, Sardesal NY, Lewis MG, Yan J, Weiner DB. Kraynyak KA, et al. Vaccine. 2010 Feb 23;28(8):1942-51. doi: 10.1016/j.vaccine.2009.10.095. Vaccine. 2010. PMID: 20188250 Free PMC article. - Accumulation of plasma cells expressing CXCR3 in the synovial sublining regions of early rheumatoid arthritis in association with production of Mig/CXCL9 by synovial fibroblasts.
Tsubaki T, Takegawa S, Hanamoto H, Arita N, Kamogawa J, Yamamoto H, Takubo N, Nakata S, Yamada K, Yamamoto S, Yoshie O, Nose M. Tsubaki T, et al. Clin Exp Immunol. 2005 Aug;141(2):363-71. doi: 10.1111/j.1365-2249.2005.02850.x. Clin Exp Immunol. 2005. PMID: 15996201 Free PMC article.
References
- Kato H, Kato R, Fujihashi K, McGhee JR. Role of mucosal antibodies in viral infections. Curr. Top. Microbiol. Immunol. 2001;260:201–228. - PubMed
- Offit PA. Correlates of protection against rotavirus infection and disease. Novartis. Found. Symp. 2001;238:106–113. - PubMed
Publication types
MeSH terms
Substances
Grants and funding
- T32 AI007290/AI/NIAID NIH HHS/United States
- R37 GM037734/GM/NIGMS NIH HHS/United States
- R37 AI047822/AI/NIAID NIH HHS/United States
- HL-67674/HL/NHLBI NIH HHS/United States
- AI-47822/AI/NIAID NIH HHS/United States
- P50 HL067674/HL/NHLBI NIH HHS/United States
- GM-37734/GM/NIGMS NIH HHS/United States
- DK-56339/DK/NIDDK NIH HHS/United States
- P30 DK056339/DK/NIDDK NIH HHS/United States
- R01 GM037734/GM/NIGMS NIH HHS/United States
- R21 AI047822/AI/NIAID NIH HHS/United States
- P01 HL067674/HL/NHLBI NIH HHS/United States
- R01 AI047822/AI/NIAID NIH HHS/United States
LinkOut - more resources
Full Text Sources
Other Literature Sources
Research Materials
Miscellaneous


