Spatial distribution and specification of mammalian replication origins during G1 phase - PubMed (original) (raw)
Spatial distribution and specification of mammalian replication origins during G1 phase
Feng Li et al. J Cell Biol. 2003.
Abstract
We have examined the distribution of early replicating origins on stretched DNA fibers when nuclei from CHO cells synchronized at different times during G1 phase initiate DNA replication in Xenopus egg extracts. Origins were differentially labeled in vivo versus in vitro to allow a comparison of their relative positions and spacing. With nuclei isolated in the first hour of G1 phase, in vitro origins were distributed throughout a larger number of DNA fibers and did not coincide with in vivo origins. With nuclei isolated 1 h later, a similar total number of in vitro origins were clustered within a smaller number of DNA fibers but still did not coincide with in vivo origins. However, with nuclei isolated later in G1 phase, the positions of many in vitro origins coincided with in vivo origin sites without further change in origin number or density. These results highlight two distinct G1 steps that establish a spatial and temporal program for replication.
Figures
Figure 1.
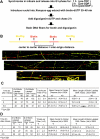
Colocalization of origins used in two consecutive cell cycles. (A) Cells were synchronized at the G1/S border with aphidicolin, released for 10 min, and then pulse labeled with CldU for 10–60 min. Labeled cells were then synchronized in mitosis and blocked at the following G1/S. Aliquots were then released for 10 min and pulse labeled with IdU for 30 min and chased for 6–13 h. DNA fibers were prepared, and CldU and IdU were detected by indirect immunofluorescence (In vivo/In vivo). In parallel, aliquots were released for 5–30 min, and nuclei from these cells were introduced into Xenopus egg extracts containing biotin-16–dUTP. In vitro replication reactions were terminated at 30 min, and DNA fibers were stained for CldU and biotin (In vivo/In vitro). (B) Exemplary fibers for each of the methods described in A are shown. In these experiments, 1–5-μm gaps between similar length (1:1 to 1:2) stretches of label were considered to be origins. Based on the lengths of purified lambda DNA molecules, we estimate fibers to be ∼2.6 kb/μm, which is in agreement with measurements made by others (Jackson and Pombo, 1998). Using this estimate, a 10-min in vivo pulse label highlights 10–20-kb stretches of DNA, in agreement with the estimates of replication fork rates in mammalian cells (30 nt/s [Brown et al., 1987]). (C) Coincidence of origins labeled in two consecutive in vivo cell cycles (In vivo/In vivo). The distances between origins were measured as described in Materials and methods. Only double labeled (IdU and CldU) fibers were scored (note that most fibers were singly labeled). Origins were scored as coincident if the center of the gaps for CldU and IdU were within 2 μm (∼5.2 kb) of each other. Shown are the percentage of CldU origins that were coincident with IdU origins (percentage of time that origins used in the first cell cycle were used in the second cell cycle) and the percentage of IdU origins that were coincident with CldU origins (percentage of time that origins used in the second cell cycle were used in the first cell cycle). Results of three independent experiments are shown (CldU coincident with IdU was scored in two of those three experiments) expressed as either the total data from all fibers in all three experiments or as the average coincidence for the three experiments and the variation between those experiments.
Figure 2.
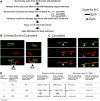
Colocalization of origins selected for initiation in vitro with those selected in vivo. (A) CHOC 400 cells were synchronized at the G1/S border with aphidicolin and then released from the aphidicolin block for 10 min. Cells were then pulse labeled with BrdU for 20–30 min and synchronized in mitosis. At 1 (pre-TDP), 2 (post-TDP), or 5.5 (post-ODP) h after mitosis, cells were collected, and intact nuclei were introduced into Xenopus egg extract supplemented with biotin-dUTP. After 30 or 40 min, nuclei were transferred to fresh extract without biotin and further incubated for 1.5–2 h. DNA fibers were then stained for BrdU and biotin. Exemplary DNA fibers are shown that display either partial overlap between BrdU and biotin label that was not scored as coincident (B) or overlap that was scored as coincident (C; many fibers did not show any overlap). In C, the green arrowheads indicate BrdU-labeled origins, and red arrowheads indicate biotin-labeled origins. Yellow arrowheads indicate the overlap. Fibers do not always show yellow label. This may be due to the interference of antibody and avidin labeling on the same DNA sites or to recurrent binding of DNA fibers to the glass surface, which interferes locally with DNA denaturation and restricts the accessibility to epitopes (Pasero et al., 2002). (D) The percentage of BrdU origins that were coincident with biotin origins (percentage of time that origins used in vivo were used in vitro) and the percentage of biotin origins that were coincident with BrdU origins (percentage of time that origins used in vitro were used in vivo) was scored as in the legend to Fig. 1. Shown are the results of four independent experiments where data were collected independently by two different investigators in a double blind manner (coincidence of biotin with BrdU was only scored in three of those experiments). Data are presented as in the legend to Fig. 1 except that p-values are included to demonstrate the significance of the differences between results obtained with pre-ODP and post-ODP nuclei. Note that the increase in biotin origins on double labeled fibers is interpreted to reflect a clustering of origins at the TDP as shown in Fig. 5.
Figure 3.
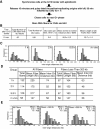
Interorigin distances in vitro. (A) Intact nuclei from cells synchronized at 1, 2, or 5.5 h after mitosis were introduced into Xenopus egg extract supplemented with biotin-dUTP for 30–40 min. Digoxigenin-dUTP was then added, and reactions were incubated for an additional 2 h. (B) Shown are three exemplary DNA fibers and a schematic diagram of how the interorigin distances were measured. (C) Images of DNA fibers were collected with a confocal microscope as indicated in Materials and methods, and both the lengths of the biotin labeled tracks, the number of tracks per fiber (on fibers containing more than one track), and the interorigin distances were scored. The differences in track lengths between 30 and 40 min are not generally statistically significant but are consistently longer for the 40-min labeling times, and the differences are consistent with prior measurements of the fork elongation rates with mammalian nuclei in Xenopus egg extracts (Dimitrova and Gilbert, 1998). (D) Same as C except nuclei were incubated in Xenopus egg extracts either in the presence (+) or absence (−) of a nondegradable derivative of geminin to inhibit pre-RC assembly in vitro. Biotin-dUTP labeling time was 40 min. For C and D, similar results were obtained in two independent experiments.
Figure 4.
Interorigin distances in vivo. Cells were synchronized at the G1/S border with aphidicolin, and the earliest replicating origins were labeled with IdU as in the legends to Figs. 1–2. After a 30-min IdU labeling period, medium was changed to medium containing CldU, and cells were incubated an additional 1 h. To allow DNA fibers to complete replication, cells were allowed to proceed into the next G1 phase. DNA fibers were then stretched and stained for IdU and CldU as in the legend to Fig. 1. (B) Interorigin distances were measured as in the legend to Fig. 3. Shown are the average results from two independent experiments. (C) Histograms comparing the interorigin distances from all fibers analyzed in Figs. 3 and 4, grouping distances into bins of 15 kb starting from 5–20 kb. (D) Relationship of interorigin distances and total fiber lengths for each dataset. When all fibers longer than the longest fiber in the in vivo dataset (dataset with the shortest fibers) are removed from each dataset, interorigin distances come into even closer agreement than for the unadjusted dataset. (E) Data for all fibers was pooled and plotted in histograms that include all fibers, only fibers longer than 180 kb, or only fibers longer than 260 kb. Also shown are the means, SD, and total number of fibers (N) for each sampling.
Figure 5.
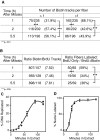
A similar number of origins localize to fewer DNA fibers at the TDP. (A) Using the fiber preparations collected in Fig. 3, the percentage of DNA fibers displaying only one versus more than one origin was determined. Results indicate a significant increase in the number of fibers containing two or more biotin tracks at the TDP, with no further increase at the ODP. (B) Using the fiber preparations collected in Fig. 2, the total number of biotin- and BrdU-labeled origins was scored for several fields of vision. For these same fields of vision, the number of fibers containing only BrdU tracks versus those containing both BrdU and biotin tracks was scored. Since preparations representing all three time points were derived from the same population of BrdU-labeled cells, these results indicate that a similar number of origins were used but that more origins were localized to early replicating DNA fibers after the TDP, with no further change at the ODP. (C) Aliquots of nuclei used for the experiments in Fig. 2, isolated from cells at 1 (squares), 2 (circles) or 5.5 (diamonds) h after mitosis, were introduced into Xenopus egg extracts supplemented with [α-32P]dATP, and the percentage of input DNA replicated was determined at the indicated times by acid precipitation (e.g., 100% DNA synthesis would indicate replication of all genomic DNA). (D) In parallel, the same preparations of nuclei were incubated in extracts supplemented with biotin-dUTP, and the percentage of biotin-labeled nuclei was scored at the indicated time points. Given that the mean replication fork elongation rate is the same for each preparation (i.e., similar labeled track lengths; Fig. 3), the data in C and D provide independent support that the same number of replication origins are used with nuclei isolated at all three G1 phase time points.
Figure 6.
Model for the progressive restriction of initiation potential during G1 phase. In early G1 phase, many sites distributed throughout the genome have an equal potential to be used as early replication origins. At the TDP, late replicating chromosomal domains become excluded from the pool of potential early replicating origins. At this time, origins within these early replicating domains still have an equal potential for initiation regardless of their position within the domain. At the ODP, a subset of these potential origins are chosen for initiation in the upcoming S phase.
Similar articles
- Mammalian nuclei become licensed for DNA replication during late telophase.
Dimitrova DS, Prokhorova TA, Blow JJ, Todorov IT, Gilbert DM. Dimitrova DS, et al. J Cell Sci. 2002 Jan 1;115(Pt 1):51-9. doi: 10.1242/jcs.115.1.51. J Cell Sci. 2002. PMID: 11801723 Free PMC article. - Nuclear transcription is essential for specification of mammalian replication origins.
Dimitrova DS. Dimitrova DS. Genes Cells. 2006 Jul;11(7):829-44. doi: 10.1111/j.1365-2443.2006.00981.x. Genes Cells. 2006. PMID: 16824201 - Transformation abrogates an early G1-phase arrest point required for specification of the Chinese hamster DHFR replication origin.
Wu JR, Keezer SM, Gilbert DM. Wu JR, et al. EMBO J. 1998 Mar 16;17(6):1810-8. doi: 10.1093/emboj/17.6.1810. EMBO J. 1998. PMID: 9501102 Free PMC article. - Origin-specific initiation of mammalian nuclear DNA replication in a Xenopus cell-free system.
Wu JR, Yu G, Gilbert DM. Wu JR, et al. Methods. 1997 Nov;13(3):313-24. doi: 10.1006/meth.1997.0530. Methods. 1997. PMID: 9441857 Review. - Initiation of chromosomal DNA replication in mammalian cell-free systems.
Krude T. Krude T. Cell Cycle. 2006 Sep;5(18):2115-22. doi: 10.4161/cc.5.18.3248. Epub 2006 Sep 15. Cell Cycle. 2006. PMID: 16969109 Review.
Cited by
- Domain-wide regulation of DNA replication timing during mammalian development.
Pope BD, Hiratani I, Gilbert DM. Pope BD, et al. Chromosome Res. 2010 Jan;18(1):127-36. doi: 10.1007/s10577-009-9100-8. Chromosome Res. 2010. PMID: 20013151 Free PMC article. - USF binding sequences from the HS4 insulator element impose early replication timing on a vertebrate replicator.
Hassan-Zadeh V, Chilaka S, Cadoret JC, Ma MK, Boggetto N, West AG, Prioleau MN. Hassan-Zadeh V, et al. PLoS Biol. 2012;10(3):e1001277. doi: 10.1371/journal.pbio.1001277. Epub 2012 Mar 6. PLoS Biol. 2012. PMID: 22412349 Free PMC article. - The functional role of Cdc6 in S-G2/M in mammalian cells.
Lau E, Zhu C, Abraham RT, Jiang W. Lau E, et al. EMBO Rep. 2006 Apr;7(4):425-30. doi: 10.1038/sj.embor.7400624. Epub 2006 Jan 27. EMBO Rep. 2006. PMID: 16439999 Free PMC article. - Control of DNA replication timing in the 3D genome.
Marchal C, Sima J, Gilbert DM. Marchal C, et al. Nat Rev Mol Cell Biol. 2019 Dec;20(12):721-737. doi: 10.1038/s41580-019-0162-y. Epub 2019 Sep 2. Nat Rev Mol Cell Biol. 2019. PMID: 31477886 Free PMC article. Review. - A model for DNA replication showing how dormant origins safeguard against replication fork failure.
Blow JJ, Ge XQ. Blow JJ, et al. EMBO Rep. 2009 Apr;10(4):406-12. doi: 10.1038/embor.2009.5. Epub 2009 Feb 13. EMBO Rep. 2009. PMID: 19218919 Free PMC article.
References
- Berezney, R., D.D. Dubey, and J.A. Huberman. 2000. Heterogeneity of eukaryotic replicons, replicon clusters, and replication foci. Chromosoma. 108:471–484. - PubMed
- Dimitrova, D., and D. Gilbert. 1998. Regulation of mammalian replication origin usage in Xenopus egg extracts. J. Cell Sci. 111:2989–2998. - PubMed
- Dimitrova, D.S., and D.M. Gilbert. 1999. The spatial position and replication timing of chromosomal domains are both established in early G1-phase. Mol. Cell. 4:983–993. - PubMed
Publication types
MeSH terms
Substances
LinkOut - more resources
Full Text Sources
Other Literature Sources
Miscellaneous


