Intact satellite cells lead to remarkable protection against Smn gene defect in differentiated skeletal muscle - PubMed (original) (raw)
. 2003 May 12;161(3):571-82.
doi: 10.1083/jcb.200210117.
Benedicte Desforges, Gaelle Millet, Jeanne Lesbordes, Carmen Cifuentes-Diaz, Dora Vertes, My Linh Cao, Fabienne De Backer, Laetitia Languille, Natacha Roblot, Vandana Joshi, Jean-Marie Gillis, Judith Melki
Affiliations
- PMID: 12743106
- PMCID: PMC2172949
- DOI: 10.1083/jcb.200210117
Intact satellite cells lead to remarkable protection against Smn gene defect in differentiated skeletal muscle
Sophie Nicole et al. J Cell Biol. 2003.
Abstract
Deletion of murine Smn exon 7, the most frequent mutation found in spinal muscular atrophy, has been directed to either both satellite cells, the muscle progenitor cells and fused myotubes, or fused myotubes only. When satellite cells were mutated, mutant mice develop severe myopathic process, progressive motor paralysis, and early death at 1 mo of age (severe mutant). Impaired muscle regeneration of severe mutants correlated with defect of myogenic precursor cells both in vitro and in vivo. In contrast, when satellite cells remained intact, mutant mice develop similar myopathic process but exhibit mild phenotype with median survival of 8 mo and motor performance similar to that of controls (mild mutant). High proportion of regenerating myofibers expressing SMN was observed in mild mutants compensating for progressive loss of mature myofibers within the first 6 mo of age. Then, in spite of normal contractile properties of myofibers, mild mutants develop reduction of muscle force and mass. Progressive decline of muscle regeneration process was no more able to counterbalance muscle degeneration leading to dramatic loss of myofibers. These data indicate that intact satellite cells remarkably improve the survival and motor performance of mutant mice suffering from chronic myopathy, and suggest a limited potential of satellite cells to regenerate skeletal muscle.
Figures
Figure 1.
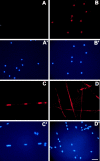
Cre recombinase and desmin expression in primary myogenic cultures. Immunolabeling of the Cre recombinase (A and C) or desmin (B and D) were performed 3 (A–B′) or 6 d after myoblast purification from (HSA-Cre) transgenic mice (C–D′). Nuclei were stained with DAPI (A′, B′, C′, and D′). Note the labeling of desmin (but not of Cre recombinase) in 3-d-old mononucleate myogenic cells, whereas in 6-d-old cells, Cre recombinase expression was observed in nuclei of fused myotubes. Bar, 40 μm.
Figure 2.
Genomic and protein analyses of Sm n in primary myogenic cultures. (A) Cre-mediated deletion of Smn exon 7 occurs 6 d after myoblast purification as determined by PCR amplification analysis of genomic DNA of (HSA-Cre, Smn F7/+) cells. DNA amplification of Cre recombinase transgene was used as internal positive control. (B) Immunoblot analysis of SMN in primary culture of skeletal muscles from control (Smn +/+) and (Smn Δ7/+) mice. Proteins were extracted from cells at day 0 (lanes 1 and 2), 3 (lanes 3 and 4), and 6 (lanes 5 and 6) after myoblast purification. Note the reduced amount of SMN in Smn Δ7/+ cells (lanes 2, 4, and 6) when compared with Smn +/+ (lanes 1, 3, and 5) and actin expression.
Figure 3.
Kinetics of growth and cell death of myogenic committed cells from ( Smn F7/ + ), (Smn Δ7/+ ), and ( HSA-Cre, _Smn_F7/ + ) transgenic mice. (A) Starting from 104 cells per plate at day 0, number of living (curve) and dead cells (solid symbols) was evaluated from day 3 to day 6. Note that the kinetics of cell growth were similar in all genotypes analyzed. Dead cells were observed in both (Smn Δ7/+) and (HSA-Cre, Smn F7/+) cells with a significantly higher number in (Smn Δ7/+) than in (HSA-Cre, Smn F7/+). No cell death was observed in controls (Smn F7/+). (B) Trypan blue dye uptake into (Smn Δ7/+) myogenic cells including mononucleate (2, arrowhead) and multinucleate cells (3, arrow) 6 d after myoblast purification. No Trypan blue uptake was observed in 6-d-old (Smn F7/+) cells (1). Bar, 40 μm.
Figure 4.
Phenotype of severe and mild mutant mice. Control littermate (A, Smn F7/+) and severe mutant mice (B, HSA-Cre, Smn F7/Δ7) at 1 mo of age. Note the posture of hindlimbs and dorsal kyphosis in severe mutant mice (B). (C and D) Mild mutant mice (HSA-Cre, Smn F7/F7) of 5 (C) or 11 mo (D). Note the marked hypotonia associated with kyphosis and reduction of muscle mass in 11-mo-old (but not in 5-mo-old) mutants.
Figure 5.
Hematoxylin and eosin staining of transverse sections of soleus from control, severe ( HSA-Cre, Smn F7/ Δ7 , and mild mutant mice (HSA-Cre, Smn F7/F7 ). At 1 mo of age, muscle histology of severe (B) or mild (C) mutants reveals necrotic fibers (arrow) and variation in fiber size (in severe mutant, only) when compared with control (A). At 2 mo of age (D), note the presence of necrotic fiber (arrow), numerous myofibers with central nuclei (arrowhead), and variation in fiber size in mild mutant mice. Marked morphological changes of skeletal muscle are observed in 6- (E) or 12-mo-old mild (F) mutant mice. Bar, 30 μm.
Figure 6.
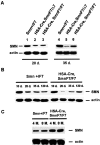
Western blot analysis of SMN in skeletal muscles from control ( Smn F7/ + ), severe ( HSA-Cre, _Smn_F7/ Δ7 ), and mild mutant mice (HSA-Cre, _Smn_F7/F7). (A) At 20 d of age (left), the residual amount of SMN in mild (lane 3) or severe mice (lane 2) was similar. A marked increased amount of SMN was observed in 35-d-old mild (but not severe) mutant mice (right). (B and C) Note the marked decrease then increase of SMN expression in mild mutant mice from 20 d to 8 mo of age. The high proportion of regenerating myofibers in which Cre-mediated deletion of Smn has not yet occurred combined with the high expression of SMN in myogenic committed cells (see Fig. 2 B) lead to a high level of SMN in mild mutant mice.
Figure 7.
Myofiber number of the entire soleus of severe and mild mutant mice. Open columns indicate the number of myofibers without central nuclei, whereas gray columns indicate those with central nuclei in mild mutant mice. At each age, three mild mutant mice were analyzed, except at 6 mo (one animal). Hatched column indicates the mean of myofiber number in three severe mutant mice at 1 mo of age. Horizontal dotted line indicates the mean of myofiber number in three control mice analyzed at 1 and 12 mo of age. Standard deviations of the mean number of myofibers with (left bar) or without central nuclei (right bar) are given. Note that regenerating myofibers with central nuclei are able to compensate for loss of mature myofibers in 2- to 6-mo-old mild mutant mice, then reduction of both regenerating and mature myofibers was observed, leading to massive loss of muscle fibers in 12-mo-old mild mutant mice.
Figure 8.
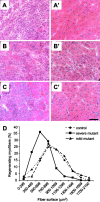
Skeletal muscle regeneration after cardiotoxin injection in control, severe, and mild mutant mice. (A–C′) At day 5 (A–C), necrotic myofibers are associated with cellular infiltration and regenerative myofibers in control (A), severe (B), and mild mutant mice (C). At day 8 (A′–C′), note the marked reduction in size of myofibers with central nuclei in severe mutants (B′) when compared with that of control (A′) or mild mutants (C′). Bar, 50 μm. (D) Distribution of regenerating myofiber surface as determined by hematoxylin and eosin staining on transverse sections of tibialis anterior 8 d after cardiotoxin injection. Note the marked change in myofiber surface profile of severe mutant mice with respect to that of either control or mild mutants (χ2, P < 0.0001). No significant difference was observed between control and mild mutant mice (χ2, P > 0.06).
Figure 9.
Satellite cells on freshly isolated muscle fibers from control, severe, and mild mutant mice. Immunolabeling of CD34 was performed on isolated muscle fibers from FDB of control (A–A′′), severe (B–B′′), and mild mutant mice (C–C′′). Reduced number of CD34-expressing satellite cells was observed in severe (but not mild) mutants. Satellite cell nuclei and myonuclei were stained with DAPI. Satellite cells do not express Sca-1 on isolated wild-type muscle fibers (D–D′′). Bar, 50 μm.
Similar articles
- Bone marrow transplantation attenuates the myopathic phenotype of a muscular mouse model of spinal muscular atrophy.
Salah-Mohellibi N, Millet G, André-Schmutz I, Desforges B, Olaso R, Roblot N, Courageot S, Bensimon G, Cavazzana-Calvo M, Melki J. Salah-Mohellibi N, et al. Stem Cells. 2006 Dec;24(12):2723-32. doi: 10.1634/stemcells.2006-0170. Epub 2006 Aug 3. Stem Cells. 2006. PMID: 16888281 - Deletion of murine SMN exon 7 directed to skeletal muscle leads to severe muscular dystrophy.
Cifuentes-Diaz C, Frugier T, Tiziano FD, Lacène E, Roblot N, Joshi V, Moreau MH, Melki J. Cifuentes-Diaz C, et al. J Cell Biol. 2001 Mar 5;152(5):1107-14. doi: 10.1083/jcb.152.5.1107. J Cell Biol. 2001. PMID: 11238465 Free PMC article. - Hypomorphic Smn knockdown C2C12 myoblasts reveal intrinsic defects in myoblast fusion and myotube morphology.
Shafey D, Côté PD, Kothary R. Shafey D, et al. Exp Cell Res. 2005 Nov 15;311(1):49-61. doi: 10.1016/j.yexcr.2005.08.019. Epub 2005 Oct 10. Exp Cell Res. 2005. PMID: 16219305 - Dormancy and quiescence of skeletal muscle stem cells.
Rocheteau P, Vinet M, Chretien F. Rocheteau P, et al. Results Probl Cell Differ. 2015;56:215-35. doi: 10.1007/978-3-662-44608-9_10. Results Probl Cell Differ. 2015. PMID: 25344673 Review. - Fishing for a mechanism: using zebrafish to understand spinal muscular atrophy.
Beattie CE, Carrel TL, McWhorter ML. Beattie CE, et al. J Child Neurol. 2007 Aug;22(8):995-1003. doi: 10.1177/0883073807305671. J Child Neurol. 2007. PMID: 17761655 Review.
Cited by
- A link between agrin signalling and Cav3.2 at the neuromuscular junction in spinal muscular atrophy.
Delers P, Sapaly D, Salman B, De Waard S, De Waard M, Lefebvre S. Delers P, et al. Sci Rep. 2022 Nov 8;12(1):18960. doi: 10.1038/s41598-022-23703-x. Sci Rep. 2022. PMID: 36347955 Free PMC article. - Abnormal motor phenotype in the SMNDelta7 mouse model of spinal muscular atrophy.
Butchbach ME, Edwards JD, Burghes AH. Butchbach ME, et al. Neurobiol Dis. 2007 Aug;27(2):207-19. doi: 10.1016/j.nbd.2007.04.009. Epub 2007 May 5. Neurobiol Dis. 2007. PMID: 17561409 Free PMC article. - Neural stem cell transplantation can ameliorate the phenotype of a mouse model of spinal muscular atrophy.
Corti S, Nizzardo M, Nardini M, Donadoni C, Salani S, Ronchi D, Saladino F, Bordoni A, Fortunato F, Del Bo R, Papadimitriou D, Locatelli F, Menozzi G, Strazzer S, Bresolin N, Comi GP. Corti S, et al. J Clin Invest. 2008 Oct;118(10):3316-30. doi: 10.1172/JCI35432. J Clin Invest. 2008. PMID: 18769634 Free PMC article. - Premature aging in skeletal muscle lacking serum response factor.
Lahoute C, Sotiropoulos A, Favier M, Guillet-Deniau I, Charvet C, Ferry A, Butler-Browne G, Metzger D, Tuil D, Daegelen D. Lahoute C, et al. PLoS One. 2008;3(12):e3910. doi: 10.1371/journal.pone.0003910. Epub 2008 Dec 11. PLoS One. 2008. PMID: 19079548 Free PMC article. - The contribution of mouse models to understanding the pathogenesis of spinal muscular atrophy.
Sleigh JN, Gillingwater TH, Talbot K. Sleigh JN, et al. Dis Model Mech. 2011 Jul;4(4):457-67. doi: 10.1242/dmm.007245. Dis Model Mech. 2011. PMID: 21708901 Free PMC article. Review.
References
- Braun, S., B. Croizat, M.C. Lagrange, J.M. Warter, and P. Poindron. 1995. Constitutive muscular abnormalities in culture in spinal muscular atrophy. Lancet. 345:694–695. - PubMed
- Burlet, P., C. Huber, S. Bertrandy, M.A. Ludosky, I. Zwaenepoel, O. Clermont, J. Roume, A.L. Delezoide, J. Cartaud, A. Munnich, and S. Lefebvre. 1998. The distribution of SMN protein complex in human fetal tissues and its alteration in spinal muscular atrophy. Hum. Mol. Genet. 7:1927–1933. - PubMed
Publication types
MeSH terms
Substances
LinkOut - more resources
Full Text Sources
Other Literature Sources
Medical
Molecular Biology Databases


