Role of Drosophila Rab5 during endosomal trafficking at the synapse and evoked neurotransmitter release - PubMed (original) (raw)
Role of Drosophila Rab5 during endosomal trafficking at the synapse and evoked neurotransmitter release
Tanja Wucherpfennig et al. J Cell Biol. 2003.
Abstract
During constitutive endocytosis, internalized membrane traffics through endosomal compartments. At synapses, endocytosis of vesicular membrane is temporally coupled to action potential-induced exocytosis of synaptic vesicles. Endocytosed membrane may immediately be reused for a new round of neurotransmitter release without trafficking through an endosomal compartment. Using GFP-tagged endosomal markers, we monitored an endosomal compartment in Drosophila neuromuscular synapses. We showed that in conditions in which the synaptic vesicles pool is depleted, the endosome is also drastically reduced and only recovers from membrane derived by dynamin-mediated endocytosis. This suggests that membrane exchange takes place between the vesicle pool and the synaptic endosome. We demonstrate that the small GTPase Rab5 is required for endosome integrity in the presynaptic terminal. Impaired Rab5 function affects endo- and exocytosis rates and decreases the evoked neurotransmitter release probability. Conversely, Rab5 overexpression increases the release efficacy. Therefore, the Rab5-dependent trafficking pathway plays an important role for synaptic performance.
Figures
Figure 1.
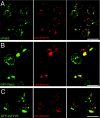
Rab5 and GFP-2xFYVE are associated to endosomal structures. Double labelings of Drosophila S2 cells showing (A) endogenous Rab5 immunostaining, (B) GFP-Rab5, or (C; left, green) GFP-2xFYVE and (A–C; middle, red) Texas red–dextran internalized upon a 5-min pulse. (Right panels) Overlay. Note that a substantial amount of the endogenous Rab5, GFP-Rab5, or GFP-2xFYVE–positive structures colocalize with the early endosomes where the dextran accumulates upon a short pulse. Bars, 10 μm.
Figure 2.
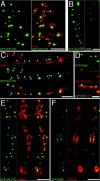
An endosomal compartment at the presynaptic terminal. (A) Double labeling showing GFP-2xFYVE (green) to monitor the endosomes and Fasciclin II immunostaining to label the NMJ presynaptic terminals (FasII, red). (B) GFP-2xFYVE fluorescence in an abdominal muscles 6/7 NMJ before (left) and after (right) a 45-min treatment with 100 nM wortmannin in vivo. Note that, upon wortmannin treatment, GFP-2xFYVE looses the punctate pattern and becomes dispersed into the cytosol. Untreated controls retained the punctate pattern (see Materials and methods). (C) Double labeling showing endogenous Rab5 immunostaining (red) and GFP-2xFYVE (green); lower panel shows merge. Arrowheads indicate Rab5 punctate structures colocalizing with GFP-2xFYVE–positive endosomes. Notice also that some of the Rab5 endosomes do not contain GFP-2xFYVE, consistent with two types of Rab5 endosomes, EEA1 positive/negative, as described previously (Wilson et al., 2000). (D) Triple labeling showing GFP-Rab5 (top, green), endosomal myc-2xFYVE immunostaining using an anti–c-myc antibody (middle, red; bottom, green) and CSP immunostaining (CSP, bottom, red) to label the presynaptic terminals in a muscles 6/7 NMJ. Bottom panel is a merge of myc-2xFYVE and CSP. GFP-Rab5 and myc-2xFYVE show a complete colocalization. Double labelings in green (E) GFP-2xFYVE or (F) GFP-Rab5 and in red FM5–95 styryl dye internalized into the presynaptic terminal upon a 1-min stimulation with 60 mM K+ to label the pool of recycling vesicles (E and F) in two different abdominal muscles 6/7 NMJs. Right panels show merge. Note that the endosomes are embedded within the pool of recycling vesicles. Genotypes: (A–C and E) w; UAS-GFP-myc-2xFYVE; elav-GAL4; (D) w; UAS-myc-2xFYVE/elav-GAL4 UAS-GFP-Rab5; and (F) w; elav-GAL4/UAS-GFP-Rab5. Bars, 5 μm. In this and the following figures, NMJs from late third instar larvae are shown unless otherwise indicated.
Figure 3.
Cryoimmuno-EM of the GFP-2xFYVE endosome. (A–D) Cryoimmuno-electron micrographs showing two Drosophila presynaptic terminals (A/B and C/D), where GFP-2xFYVE is labeled by 10-nm gold particles (anti-GFP antibody). (B and D) High magnifications of the boxes in A and C, respectively. We found cisternal structures of around 150 nm associated to a more electron-dense region within the terminal. The darker regions allow a better contrast for visualization of the membrane (which appear lighter in cryosections) associated to the endosomes, compared with the vesicles with a diameter of ∼35 or 70 nm (see also Fig. 7). Vesicles are, however, occasionally observed (arrowheads). Only few gold particles (7.8 ± 1.3%, n = 5 sections) are associated to the vesicles (arrows). Cryoimmuno-electron micrographs showing localization of GFP-2xFYVE (10-nm gold particles) and endogenous CSP (5 nm gold; E and F) or endogenous Rab5 (5 nm gold; G and H). (F and H) High magnifications of the boxes in E and G, respectively. (E and F) CSP appears throughout the bouton area associated to the pool of vesicles, whereas GFP-2xFYVE is largely restricted to the cisternal endosomal compartments. Although not many vesicles are distinguishable (F, arrow), their presence is revealed by staining of SV integral membrane protein CSP. Few 5-nm gold particles labeling CSP could also be observed in the cisternal structures (F, arrowheads). Rab5 appears in the cisternal structures, (H, arrowheads) as well as in other regions corresponding to vesicles or cytosol (H, arrows). Note that immunodetection is highly specific, because neither 10-nm (GFP-2xFYVE) or 5-nm gold particles (CSP and Rab5) were very rarely detected in the postsynaptic subsynaptic reticulum or the mitochondria in the cryosections (<1% of the gold particles; A–H; unpublished data). t, T-bar or electron-dense regions indicating active zones; mt, mitochondria. Bars: (A–D) 150 nm; (E–H) 200 nm.
Figure 4.
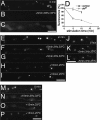
Membrane exchange between vesicles and the synaptic endosome. GFP-2xFYVE labeling in a (A) shi ts mutant terminal at 25°C and (B and C) after 5 min of stimulation (30 Hz, normal saline) at 33°C. Genotype: shi ts; elav-GAL4 UAS-GFP-myc-2xFYVE. (C) Same image as in B, with increased contrast and brightness to show diffused GFP-2xFYVE fluorescence at the terminal. The endosome is drastically reduced together with the pool of vesicles in shi ts terminals. No change was observed in resting or stimulated control NMJs or in shi ts at 25°C. The endosomes remained also normal in resting shi ts NMJs at 33°C. (D) Kinetics of disappearance of the endosome. Time course of the changes in GFP-2xFYVE fluorescence in shi ts; elav-GAL4 UAS-GFP-myc-2xFYVE (shi ts; n = 5 NMJs) and w; elav-GAL4 UAS-GFP-myc-2xFYVE (control; n = 4 NMJs) during 3 Hz at 33°C. Fluorescence in ordinates refers to mean pixel brightness at the punctate structures normalized to the mean brightness before stimulation. After 20 min of stimulation at 33°C in shi ts (dashed line), GFP-2xFYVE fluorescence at the endosome cannot be distinguished. (E) GFP-2xFYVE labeling in a shi ts mutant terminal at 25°C and (F) after stimulation at 33°C for 5 and (G) 10 min at 3 Hz. (H and I) GFP-2xFYVE fluorescence recovery at the endosomes in the same synapses upon downshift to 25°C for (H) 15 and (I) 30 min. Genotype in E–I: shi ts; elav-GAL4 UAS-GFP-myc-2xFYVE. Fluorescence is recovered after releasing the endocytosis block, suggesting that the endosome recovers from membrane derived by dynamin-mediated endocytosis. (J–L) Control: w; elav-GAL4 UAS-GFP-myc-2xFYVE synapses showing GFP-2xFYVE fluorescence upon a 3-Hz stimulation during the same time intervals (J, 0 min; K, 5 min; L, 10 min) at 25°C. (M) GFP-2xFYVE labeling in a shi ts1 mutant terminal at 25°C and (N) after stimulation at 33°C during 10 min at 3 Hz. (O) GFP-2xFYVE fluorescence in the same synapses maintained at 33°C for 15 min after stimulation followed by (P) downshift to 25°C for 15 min. In the resting terminal, fluorescence is recovered at the endosome only if the endocytosis block is released, indicating that endosomal recovery occurs at the expense of newly formed endocytic vesicles. In A–P NMJs belong to A2–A4 abdominal muscles 6/7. Bars, 5 μm. In this and the following figures the error bars are standard errors.
Figure 5.
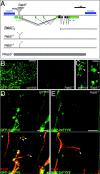
Rab5 loss of function mutants show disrupted endosomes. (A) Rab5 genomic organization. (Green/black bars) Rab5 exons. (1–7) Alternative 5′ leader exons. (a and b) Alternative 3′ untranslated regions. (Black bars) ORF. (Blue arrows) Rab5 flanking genes (CG4272 and CG7245). (00231 and K08232) P-element insertions. We renamed l(2)K08232 as Rab5 1. (Rab5 2) 4-kb deletion generated by imprecise excision of Rab5 1. Rab5 3 and Rab5 4 are imprecise excisions where P-element LTR sequences remained (see Materials and methods). PRab5 + (hatched bar), region contained in the genomic Rab5 rescue. (B) GFP-2xFYVE labeling in the CNS of control (left, genotype: w; elav-GAL4 UAS-GFP-myc-2xFYVE) and Rab5 2 mutant embryos stage 17 (right, Rab5 2 ; elav-GAL4 UAS-GFP-myc-2xFYVE). Note, in the control, the punctate appearance of endosomes labeled by GFP-2xFYVE in the soma of the CNS and in Rab5 2 mutant embryos the diffuse GFP-2xFYVE fluorescence dispersed in the cytosol, indicating that the endosome is severely affected. (C) GFP-2xFYVE labeling in the PNS of control (left) and Rab5 2 embryos (right). Genotypes as in B. (Arrowheads) Pentachordotonal sensory neurons. (D and E) Double labeling showing the GFP-2xFYVE marked endosomes (green) and Fasciclin II immunostainings (red) to monitor the motoneurons at the NMJ (arrowheads) of control (D) and Rab5 2 embryos (E). Lower panels, merges of the two channels. Genotypes as in B. Note that few remnant GFP-2xFYVE punctate structures can be observed occasionally in the Rab5 2 mutant embryos, probably due to rescue by the Rab5 maternal contribution. Bars: (B) 20 μm; (C–E) 10 μm.
Figure 6.
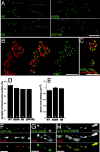
Normal synaptic morphology and disrupted endosomes in mutant Rab5 expressing presynaptic terminals. (A) CSP immunolabeling of muscles 6/7 NMJs in the A2 segment of wild-type (WT), w; UAS-Rab5S43N/+_; elav-GAL4/+ (R5SN), w; UAS-Rab5/+; elav-GAL4/+ (R5), and w; elav-GAL4/UAS-GFP-Rab5 (GFP-R5) larvae. (B and C) Double immunostaining showing the centers of endocytosis labeled with α-adaptin (red) and the active zones of exocytosis labeled with nc82 antibodies (green) in a (B) wild-type and a (C) w; UAS-Rab5S43N/+; elav-GAL4/+ presynaptic terminal. In B, middle panel is the merge. (D) Mean synaptic surface area and (E) mean active zone density in muscles 6/7 of A2 in wild-type and different mutants. Active zone density is the number of nc82 active zones per terminal area. Genotypes as in A. Numbers in the columns are the number of NMJs (D) and presynaptic terminals quantified (E). Neither the synaptic area nor the active zone density is significantly different in the mutants, implying that the total number of active zones is normal in the mutants. (F) Double labeling showing GFP-Rab5 and CSP immunostaining to monitor the presynaptic terminal in a w; UAS-GFP-Rab5/elav-GAL4 NMJ. (Bottom panel) Merge of the GFP-Rab5 (green) and CSP (red) stainings. Note the punctate staining of GFP-Rab5 associated to the endosomes. (G) Double labeling showing GFP-Rab5S43N and HRP immunostaining to monitor the NMJ in a w; UAS-GFP-Rab5S43N/+; elav-GAL4/_+ NMJ. (Bottom panel) Merge of the GFP-Rab5S43N (green) and HRP (red) stainings. GFP-Rab5S43N is not associated to endosomes and appears dispersed in the cytosol of the presynaptic terminal. (H) Double labeling showing GFP-2xFYVE to label the endosomes and HRP immunostaining to monitor the presynaptic terminal in a w; UAS-GFP-myc-2xFYVE; elav-GAL4/UAS-Rab5S43N NMJ. (Bottom panel) Merge of the GFP-2xFYVE (green) and HRP (red) stainings. The GFP-2xFYVE endosomal compartment is disrupted upon expression of the dominant-negative Rab5S43N mutant as indicated by the cytosolic GFP-2xFYVE appearance. Bars: (A) 50 μm; (B, C, and F–H) 5 μm. In this and the following figures, when wild-type or mutant Rab5 was expressed using the UAS/GAL4 system, embryonic and early larval development took place at 16°C and animals were shifted to 25°C only during the last 2 d of larval development. When 29°C is indicated, the last 2 d were at this temperature. The controls were submitted to the same procedure.
Figure 7.
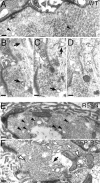
Endocytic intermediates are affected in Rab5 mutant presynaptic terminals. Ultrastructure of presynaptic terminals of wild-type (A–D), w; UAS-Rab5S43N/+_; elav-GAL4/+ (E), and w; UAS-Rab5/+; elav-GAL4/_+ third instar larvae (F). (A and E) Solid arrowheads indicate endocytic intermediates with an average diameter of 70 nm. (B–D) Electron micrographs corresponding to serial sections from a wild-type synapse showing cisternal (black arrows) and tubular (white arrows) endosomal structures. Bars, 100 nm. Cisternal structures are frequently detected in serial sections spanning 500 nm–1 μm, but are not present in each of the sections through the synapse. In Rab5S43N-expressing terminals (E), an accumulation of the 70-nm vesicles was observed (solid arrowhead). In Rab5-overexpressing terminals (F), tubules (white arrows), cisternae (black arrow), and multivesicular bodies (white arrowheads) were found in each section throughout the synapse, indicating an expansion of the endosomal compartment. No major change was observed in other synaptic features neither in Rab5S43N nor in Rab5 overexpressing terminals including the number and structure of the T-bars, the number of docked vesicles defined as vesicles touching the plasma membrane at the T-bar (WT: 1.31 ± 0.24, n = 17; Rab5S43N: 1.67 ± 0.20, n = 30; Rab5: 1.29 ± 0.22, n = 14; GFP-Rab: 1.22 ± 0.18, n = 10), the overall appearance of the presynaptic terminal and the subsynaptic reticulum postsynaptically.
Figure 8.
Rab5 mutations affect the SV pool size and the kinetics of uptake and release. (A–C) FM1–43 uptake. FM1–43 staining upon dye internalization for 3 min at 3 Hz (HL3, 1.5 mM Ca2+) in (A) wild-type and (B) w; UAS-Rab5S43N/+; _elav-GAL4/+ mutant presynaptic terminals. (C) Time course of FM1–43 uptake during simulation at 3 Hz (HL3, 1.5 mM Ca2+) for 3, 5, and 10 min in wild type (black) and w; UAS-Rab5S43N/+; elav-GAL4/+ (red). Fluorescence refers to average pixel brightness values at the terminal normalized as percentage with respect to the average fluorescence in wild type after 10 min. In the case of Rab5S43N, for the uptake quantification after 3 min (asterisk), the terminals were counterstained with the red FM5–95 dye in order to be able to distinguish the terminals and quantify the low levels of uptake. Numbers in each time point correspond to the number of NMJs quantified. (D–F) Recycling SV pool size. FM1–43 staining in (D) wild-type and (E) w; UAS-Rab5S43N/+; elav-GAL4/_+ terminals after 3 min at 30 Hz (normal saline, 2 mM Ca2+. (F) Quantification of FM1–43 internalization upon dye uptake as in D and E in wild-type (black) and UAS-Rab5S43N/+; _elav-GAL4/+ mutant terminals (red). Fluorescence is normalized as percentage with respect to the average fluorescence in wild type. Numbers in the columns are the number of NMJs analyzed. The amount of internalized FM1–43 reaches equilibrium after 3 min. Note the highly significant reduction to 64.15 ± 2.9% (P < 0.001; ANOVA) in the mutant. (G–M) FM1–43 release. FM1–43 fully loaded SV pool stained as in D–F in (G) wild-type and (J) w; UAS-Rab5S43N/+; elav-GAL4/+ mutant terminals. Staining of the same wild-type (H and I) and mutant (K and L) NMJs after 5 (H and K) and 40 min (I and L) of release by stimulation at 3 Hz (normal saline, 2 mM Ca2+). Brightness in G and J was adjusted for the best contrast of the signal and the imaging conditions were maintained in H and I and K and L, respectively. (M) Time course of FM1–43 release in wild-type (black; n = 6 NMJs), and w; UAS-Rab5S43N/+; elav-GAL4/_+ (red; n = 7 NMJs) presynaptic terminals. Terminals were first fully loaded as in D–F and fluorescence was quantified. Afterwards, they were stimulated at 3 Hz (normal saline, 2 mM Ca2+) during 5, 10, 20, 30, and 40 min to study the release kinetics (see Materials and methods). Fluorescence refers to average brightness pixel values at the terminals normalized as percentage with respect to the average fluorescence of the fully loaded SV pool before release. Bars, 5 μm. Only presynaptic terminals of abdominal A2–A4 muscles 6/7 NMJs were analyzed.
Figure 9.
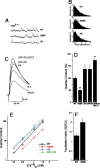
NT release probability is affected in Rab5 mutant synapses. (A) Spontaneous mEJP traces from wild-type (WT), w; UAS-Rab5S43N/+_; elav-GAL4/_+ (R5SN), and UAS-Rab5/+; elav-GAL4/+ (R5) mutant muscle 6. (B) mEJP amplitude distribution from WT, (n = 6,187 events); R5SN, (n = 4,395); R5, (n = 3,391) NMJs. In the different genotypes studied, there were no significant differences in the mean mEJP amplitude (mV; WT, 1.3 ± 0.06, n = 35; R5SN, 1.3 ± 0.06, n = 28; R5, 1.3 ± 0.07, n = 13 muscle 6) or mean mEJP frequency (Hz; WT, 3.7 ± 0.17, n = 35; R5SN, 3.3 ± 0.23, n = 28; R5, 2.8 ± 0.17, n = 13 muscle 6). We also found no difference if we overexpressed the GFP-Rab5 fusion at the presynaptic terminal (mEJP amplitude [mV]: GFP-Rab5 (25°C) 1.4 ± 0.06, n = 35; GFP-Rab5 (29°C), 1.2 ± 0.05, n = 17. mEJP frequency (Hz): GFP-Rab5 (25°C), 3.1 ± 0.18, n = 35; GFP-Rab5 (29°C), 3.0 ± 0.14, n = 17). (C) Nerve-evoked EJP trace averages from wild-type and different Rab5 mutants. (Genotypes in C–F) Wild-type (WT); w; UAS-Rab5S43N/+; elav-GAL4/+ (R5SN); w; UAS-Rab5/+; elav-GAL4/+ (R5); w; elav-GAL4/UAS-GFP-Rab5 (GFP-R5); and w; elav-GAL4/UAS-GFP-Rab5 raised at 29°C during the last 2 d of larval development (GFP-R5 [29°C]). The mean amplitudes were (mV): WT; 23.5 ± 1.4; R5SN, 12.9 ± 1.2, P < 0.01 (ANOVA); R5, 28.0 ± 1.5, P < 0.05; GFP-R5, 30 ± 1.1, P < 0.01; GFP-Rab5 (29°C), 33 ± 1.2, P < 0.01. (D) Mean quantal content in wild-type and different Rab5 mutants. Quantal content is normalized as percentage of wild-type. (Numbers in columns) Number of muscle 6 analyzed. One asterisk denotes P < 0.05 significance values with respect to wild type, and two asterisks, P < 0.01. No significant difference in the evoked EJP amplitudes or quantal contents were observed in the controls submitted to the 29°C treatment when compared with animals at 25°C. (E) Ca2+ dependence of the quantal content in WT (black ○), R5SN (red □), R5 (blue ♦), and GFP-R5 (green ×). (F) Facilitation index calculated as mean ratio of the quantal contents of the second versus the first response in a paired pulse stimulation protocol with a 20-ms interpulse interval. (Numbers in the columns) Number of muscles 6 analyzed. Q2/Q1 was significantly higher (P < 0.05) in Rab5S43N with respect to wild-type. The recording solution used in A–D and F consisted of HL3 containing 0.75 mM Ca2+.
Similar articles
- Drosophila endosomal proteins hook and deep orange regulate synapse size but not synaptic vesicle recycling.
Narayanan R, Krämer H, Ramaswami M. Narayanan R, et al. J Neurobiol. 2000 Nov 5;45(2):105-19. doi: 10.1002/1097-4695(20001105)45:2<105::aid-neu5>3.0.co;2-x. J Neurobiol. 2000. PMID: 11018772 - Rab3a deletion reduces vesicle docking and transmitter release at the mouse diaphragm synapse.
Coleman WL, Bill CA, Bykhovskaia M. Coleman WL, et al. Neuroscience. 2007 Aug 10;148(1):1-6. doi: 10.1016/j.neuroscience.2007.06.011. Epub 2007 Jul 20. Neuroscience. 2007. PMID: 17640821 - Drosophila synaptotagmin I null mutants show severe alterations in vesicle populations but calcium-binding motif mutants do not.
Loewen CA, Royer SM, Reist NE. Loewen CA, et al. J Comp Neurol. 2006 May 1;496(1):1-12. doi: 10.1002/cne.20868. J Comp Neurol. 2006. PMID: 16528727 - Synaptic vesicle pools and plasticity of synaptic transmission at the Drosophila synapse.
Kidokoro Y, Kuromi H, Delgado R, Maureira C, Oliva C, Labarca P. Kidokoro Y, et al. Brain Res Brain Res Rev. 2004 Dec;47(1-3):18-32. doi: 10.1016/j.brainresrev.2004.05.004. Brain Res Brain Res Rev. 2004. PMID: 15572160 Review. - Endosomal trafficking of AMPA-type glutamate receptors.
Hirling H. Hirling H. Neuroscience. 2009 Jan 12;158(1):36-44. doi: 10.1016/j.neuroscience.2008.02.057. Epub 2008 Mar 6. Neuroscience. 2009. PMID: 18406063 Review.
Cited by
- Asrij maintains the stem cell niche and controls differentiation during Drosophila lymph gland hematopoiesis.
Kulkarni V, Khadilkar RJ, Magadi SS, Inamdar MS. Kulkarni V, et al. PLoS One. 2011;6(11):e27667. doi: 10.1371/journal.pone.0027667. Epub 2011 Nov 14. PLoS One. 2011. PMID: 22110713 Free PMC article. - Drosophila Pkaap regulates Rab4/Rab11-dependent traffic and Rab11 exocytosis of innate immune cargo.
Sorvina A, Shandala T, Brooks DA. Sorvina A, et al. Biol Open. 2016 Jun 15;5(6):678-88. doi: 10.1242/bio.016642. Biol Open. 2016. PMID: 27190105 Free PMC article. - RhoGAP68F controls transport of adhesion proteins in Rab4 endosomes to modulate epithelial morphogenesis of Drosophila leg discs.
de Madrid BH, Greenberg L, Hatini V. de Madrid BH, et al. Dev Biol. 2015 Mar 15;399(2):283-95. doi: 10.1016/j.ydbio.2015.01.004. Epub 2015 Jan 21. Dev Biol. 2015. PMID: 25617722 Free PMC article. - Numb and alpha-Adaptin regulate Sanpodo endocytosis to specify cell fate in Drosophila external sensory organs.
Hutterer A, Knoblich JA. Hutterer A, et al. EMBO Rep. 2005 Sep;6(9):836-42. doi: 10.1038/sj.embor.7400500. EMBO Rep. 2005. PMID: 16113648 Free PMC article. - Elementary properties of spontaneous fusion of peptidergic vesicles: fusion pore gating.
Vardjan N, Stenovec M, Jorgacevski J, Kreft M, Zorec R. Vardjan N, et al. J Physiol. 2007 Dec 15;585(Pt 3):655-61. doi: 10.1113/jphysiol.2007.136135. Epub 2007 Jun 7. J Physiol. 2007. PMID: 17556387 Free PMC article. Review.
References
- Atwood, H.L., C.K. Govind, and C.F. Wu. 1993. Differential ultrastructure of synaptic terminals on ventral longitudinal abdominal muscles in Drosophila larvae. J. Neurobiol. 24:1008–1024. - PubMed
- Betz, W.J., and G.S. Bewick. 1992. Optical analysis of synaptic vesicle recycling at the frog neuromuscular junction. Science. 255:200–203. - PubMed
- Brand, A., A.S. Manoukian, and N. Perrimon. 1996. Ectopic expression in Drosophila Drosophila melanogaster: Practical Uses in Cell and Molecular Biology. L.S.B. Goldstein and E.A. Fyrberg, editors. Academic Press, San Diego. 635–654.
Publication types
MeSH terms
Substances
LinkOut - more resources
Full Text Sources
Other Literature Sources
Molecular Biology Databases
Miscellaneous
