Spherical aggregates of beta-amyloid (amylospheroid) show high neurotoxicity and activate tau protein kinase I/glycogen synthase kinase-3beta - PubMed (original) (raw)
Spherical aggregates of beta-amyloid (amylospheroid) show high neurotoxicity and activate tau protein kinase I/glycogen synthase kinase-3beta
Minako Hoshi et al. Proc Natl Acad Sci U S A. 2003.
Abstract
beta-Amyloid (Abeta) acquires toxicity by self-aggregation. To identify and characterize the toxic form(s) of Abeta aggregates, we examined in vitro aggregation conditions by using large quantities of homogenous, chemically synthesized Abeta1-40 peptide. We found that slow rotation of Abeta1-40 solution reproducibly gave self-aggregated Abeta1-40 containing a stable and highly toxic moiety. Examination of the aggregates purified by glycerol-gradient centrifugation by atomic force microscopy and transmission electron microscopy revealed that the toxic moiety is a perfect sphere, which we call amylospheroid (ASPD). Other Abeta1-40 aggregates, including fibrils, were nontoxic. Correlation studies between toxicity and sphere size indicate that 10- to 15-nm ASPD was highly toxic, whereas ASPD <10 nm was nontoxic. A positive correlation between the toxicity and ASPD >10 nm also appeared to exist when Abeta1-42 formed ASPD by slow rotation. However, Abeta1-42-ASPD formed more rapidly, killed neurons at lower concentrations, and showed approximately 100-fold-higher toxicity than Abeta1-40-ASPD. The toxic ASPD was associated with SDS-resistant oligomeric bands in immunoblotting, which were absent in nontoxic ASPD. Because the formation of ASPD was not disturbed by pentapeptides that break beta-sheet interactions, Abeta may form ASPD through a pathway that is at least partly distinct from that of fibril formation. Inhibition experiments with lithium suggest the involvement of tau protein kinase I/glycogen synthase kinase-3beta in the early stages of ASPD-induced neurodegeneration. Here we describe the identification and characterization of ASPD and discuss its possible role in the neurodegeneration in Alzheimer's disease.
Figures
Fig. 1.
ASPD as a neurotoxin in Aβ1–40 aggregates. (A)Aβ1–40 solutions (350 μM) were aggregated, and their toxicity was estimated by MTT assay (n = 6). Aβ1–40 solution was rotated in Eppendorf tubes (•), glass tubes (▵), carbon-coated tubes (○), gold-coated tubes (⊞), and silicon-coated tubes (▴). Aβ1–40 solution without rotation also is shown ( ). Hereafter, we designated toxic Aβ1–40 aggregates formed by slowly rotating Aβ1–40 solution (350 μMin50% PBS) as SR350–Aβ1–40. (B) The structure and toxicity of Aβ1–40 aggregates formed by slow rotation. At the indicated time, aliquots were removed from SR350–Aβ1–40 for transmission electron microscopy and MTT assay (n = 9) (5 μM). (C) Aβ1–40 solutions [350 μM (SR350–Aβ1–40), 50 μM (SR50–Aβ1–40), and 1 μM (SR1–Aβ1–40)] each were rotated slowly for 7 days, and the toxicity was assessed (n = 7). Thioflavine T assay (20 μM; Sigma; excitation at 445 nm and emission at 485 nm; ref. 48) determined fibril content in freshly dissolved Aβ1–40 and in each SR–Aβ1–40 (n = 6). (D) SR350–Aβ1–40 was prepared with or without KLVFF or LPFFD. The toxicity was determined by MTT assay (n = 9) or propidium iodide staining (Right). Image of SR350–Aβ1–40 with LPFFD is shown (bar, 100 nm). Also shown are SR350–Aβ1–40 (○) with KLVFF (•) and with LPFFD (
 ). Data represent the mean ± SE. *, Significant difference from the control. The results suggest that toxicity of SR350–Aβ1–40 is associated with the spherical structures (B, 4 h), which we call ASPD.
Fig. 2.
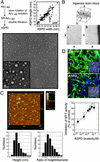
ASPD morphology and toxicity. (A) Transmission electron microscopic images of isolated ASPD (bars, 100 nm in Lower and 20 nm in Inset). The width (x) and length (y) of each ASPD (n = 101) were measured (Upper). (B) Images of horizontal sections (a) and cross sections (b) of ASPD in the resin as described in Materials and Methods. (C) Fluid-phase atomic force microscopy of ASPD as described in Materials and Methods (n = 100). (D) Toxicity of ASPD. (Top and Middle) After a 40-h ASPD treatment (210 nM), cultures were stained with anti-MAP2 (green) and fillipin (blue). ASPD killed ≈40% neurons, with shrunken or fragmented nuclei stained pink with propidium iodide and Hoechst 33258 (Inset). Cell death in the control culture was <3%. (Bottom) ASPD toxicity was estimated by MTT activity (n = 6). Data in D represent the mean ± SE. *, Significant difference compared with control.
Fig. 3.
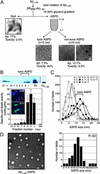
Purification of toxic ASPD by the glycerol gradient. (A) ASPD and fibrils in SR350–Aβ1–40 were fractionated as shown. Transmission electron microscopic images of representative fractions are shown. Aβ recovery and percentage of the total toxicity in glycerol gradient are indicated. (B) Immunoblottings with 4G8 of each fraction and of freshly dissolved Aβ1–40 are shown (Upper). Fraction 2 induced apoptotic cell death as shown by red arrows in propidium iodide and Hoechst 33258 staining, whereas fraction 11 did not (Lower Inset). Mini-Bradford assay quantitated Aβ content, using freshly dissolved Aβ1–40 as a standard, the concentration of which was determined accurately in advance with a Waters AccQTag system. Comparison of results from mini-Bradford assay with the AccQTag system data by using unfractionated SR350–Aβ1–40 proved a good correlation at concentrations >1 μM. The specific cell death activity was calculated from the Aβ content and the apoptotic activity (n = 16); one unit is defined as the activity inducing 1% apoptotic cell death. The specific cell death activity values of unfractionated SR350–Aβ1–40 and fibrils were 0.37 ± 0.09 and 0.07 ± 0.003, respectively. Data represent the mean ± SE. *, Significant difference compared with control. (C) The particle distribution of each fraction. (D Left) Transmission electron microscopic images of ASPD formed in Aβ1–42 solution (0.1 μMin50% PBS) after an 8-h slow rotation (bar, 20 nm). (Right)Aβ1–42-ASPD was separated by a glycerol gradient as in A. The particle distribution of fraction 2, in which the highest toxicity was recovered in repeated experiments (n = 7), is shown.
Fig. 4.
Lithium suppression of ASPD toxicity. (A Upper) After 210-nM ASPD treatment, TPKI/GSK-3β activity was assayed at the indicated time (n = 6). (Lower) Lithium (2 mM) was added to ASPD-treated culture at the indicated time, and the toxicity was assayed (n = 6). (B) Dose-dependent inhibition of ASPD toxicity by lithium. Effect of lithium on 210-nM ASPD toxicity was examined (n = 6). (C) Lithium protection against ASPD-induced apoptosis. After the treatment, as indicated, propidium iodide and Hoechst 33258 staining was performed (n = 9). Data represent the mean ± SE. Significant difference compared with control (*) or with ASPD-treated culture (**).
Similar articles
- Antibodies against beta-amyloid reduce Abeta oligomers, glycogen synthase kinase-3beta activation and tau phosphorylation in vivo and in vitro.
Ma QL, Lim GP, Harris-White ME, Yang F, Ambegaokar SS, Ubeda OJ, Glabe CG, Teter B, Frautschy SA, Cole GM. Ma QL, et al. J Neurosci Res. 2006 Feb 15;83(3):374-84. doi: 10.1002/jnr.20734. J Neurosci Res. 2006. PMID: 16385556 - Amyloid-beta-induced neurotoxicity is reduced by inhibition of glycogen synthase kinase-3.
Koh SH, Noh MY, Kim SH. Koh SH, et al. Brain Res. 2008 Jan 10;1188:254-62. doi: 10.1016/j.brainres.2007.10.064. Epub 2007 Nov 1. Brain Res. 2008. PMID: 18031715 - Lithium down-regulates tau in cultured cortical neurons: a possible mechanism of neuroprotection.
Rametti A, Esclaire F, Yardin C, Cogné N, Terro F. Rametti A, et al. Neurosci Lett. 2008 Mar 21;434(1):93-8. doi: 10.1016/j.neulet.2008.01.034. Epub 2008 Jan 19. Neurosci Lett. 2008. PMID: 18289787 - Physicochemical characteristics of soluble oligomeric Abeta and their pathologic role in Alzheimer's disease.
Watson D, Castaño E, Kokjohn TA, Kuo YM, Lyubchenko Y, Pinsky D, Connolly ES Jr, Esh C, Luehrs DC, Stine WB, Rowse LM, Emmerling MR, Roher AE. Watson D, et al. Neurol Res. 2005 Dec;27(8):869-81. doi: 10.1179/016164105X49436. Neurol Res. 2005. PMID: 16354549 Review.
Cited by
- GSK3β is involved in the relief of mitochondria pausing in a Tau-dependent manner.
Llorens-Martín M, López-Doménech G, Soriano E, Avila J. Llorens-Martín M, et al. PLoS One. 2011;6(11):e27686. doi: 10.1371/journal.pone.0027686. Epub 2011 Nov 14. PLoS One. 2011. PMID: 22110721 Free PMC article. - Passive anti-amyloid immunotherapy in Alzheimer's disease: What are the most promising targets?
Moreth J, Mavoungou C, Schindowski K. Moreth J, et al. Immun Ageing. 2013 May 11;10(1):18. doi: 10.1186/1742-4933-10-18. Immun Ageing. 2013. PMID: 23663286 Free PMC article. - Isolation and characterization of patient-derived, toxic, high mass amyloid beta-protein (Abeta) assembly from Alzheimer disease brains.
Noguchi A, Matsumura S, Dezawa M, Tada M, Yanazawa M, Ito A, Akioka M, Kikuchi S, Sato M, Ideno S, Noda M, Fukunari A, Muramatsu S, Itokazu Y, Sato K, Takahashi H, Teplow DB, Nabeshima Y, Kakita A, Imahori K, Hoshi M. Noguchi A, et al. J Biol Chem. 2009 Nov 20;284(47):32895-905. doi: 10.1074/jbc.M109.000208. Epub 2009 Sep 15. J Biol Chem. 2009. PMID: 19759000 Free PMC article. - A Review of African Medicinal Plants and Functional Foods for the Management of Alzheimer's Disease-related Phenotypes, Treatment of HSV-1 Infection and/or Improvement of Gut Microbiota.
Tettevi EJ, Maina M, Simpong DL, Osei-Atweneboana MY, Ocloo A. Tettevi EJ, et al. J Evid Based Integr Med. 2022 Jan-Dec;27:2515690X221114657. doi: 10.1177/2515690X221114657. J Evid Based Integr Med. 2022. PMID: 35866220 Free PMC article. Review. - Effects of Ischemic Stroke on Interstitial Fluid Clearance in Mouse Brain: a Bead Study.
Yang T, Sun Y, Li Q, Alraqmany N, Zhang F. Yang T, et al. Cell Mol Neurobiol. 2023 Nov;43(8):4141-4156. doi: 10.1007/s10571-023-01400-1. Epub 2023 Aug 27. Cell Mol Neurobiol. 2023. PMID: 37634198
References
- Glenner, G. G. & Wong, C. W. (1984) Biochem. Biophys. Res. Commun. 120, 885–890. - PubMed
- Selkoe, D. J. (2001) Physiol. Rev. 81, 741–766. - PubMed
- Schenk, D., Barbour, R., Dunn, W., Gordon, G., Grajeda, H., Guido, T., Hu, K., Huang, J., Johnson-Wood, K., Khan, K., et al. (1999) Nature 400, 173–177. - PubMed
- Janus, C., Pearson, J., McLaurin, J., Mathews, P. M., Jiang, Y., Schmidt, S. D., Chishti, M. A., Horne, P., Heslin, D., French, J., et al. (2000) Nature 408, 979–982. - PubMed
- Morgan, D., Diamond, D. M., Gottschall, P. E., Ugen, K. E., Dickey, C., Hardy, J., Duff, K., Jantzen, P., DiCarlo, G., Wilcock, D., et al. (2000) Nature 408, 982–985. - PubMed
Publication types
MeSH terms
Substances
LinkOut - more resources
Full Text Sources
Other Literature Sources
Miscellaneous


