A1 receptor and adenosinergic homeostatic regulation of sleep-wakefulness: effects of antisense to the A1 receptor in the cholinergic basal forebrain - PubMed (original) (raw)
A1 receptor and adenosinergic homeostatic regulation of sleep-wakefulness: effects of antisense to the A1 receptor in the cholinergic basal forebrain
Mahesh M Thakkar et al. J Neurosci. 2003.
Abstract
We hypothesized that adenosine, acting via the A1 receptor, is a key factor in the homeostatic control of sleep. The increase in extracellular levels of adenosine during prolonged wakefulness is thought to facilitate the transition to sleep by reducing the discharge activity of wakefulness-promoting neurons in the basal forebrain. Adenosine A1 receptor control of the homeostatic regulation of sleep was tested by microdialysis perfusion of antisense oligonucleotides against the mRNA of the A1 receptor in the magnocellular cholinergic region of the basal forebrain of freely behaving rats. After microdialysis perfusion of A1 receptor antisense in the basal forebrain, spontaneous levels of sleep-wakefulness showed a significant reduction in non-rapid eye movement (REM) sleep with an increase in wakefulness. After 6 hr of sleep deprivation, the antisense-treated animals spent a significantly reduced amount of time in non-REM sleep, with postdeprivation recovery sleep hours 2-5 showing a reduction of approximately 50-60%. There was an even greater postdeprivation reduction in delta power (60-75%) and a concomitant increase in wakefulness. All behavioral state changes returned to control (baseline) values after the cessation of antisense administration. Control experiments with microdialysis perfusion of nonsense (randomized antisense) oligonucleotides and with artificial CSF showed no effect during postdeprivation recovery sleep or spontaneously occurring behavioral states. Antisense to the A1 receptor suppressed A1 receptor immunoreactivity but did not show any neurotoxicity as visualized by Fluoro-Jade staining. These data support our hypothesis that adenosine, acting via the A1 receptor, in the basal forebrain is a key component in the homeostatic regulation of sleep.
Figures
Figure 1.
A, Schematic representation of the anatomical location of the histologically identified probe tip sites in 28 animals. All sites were located between anteroposterior -0.2 and -0.8 mm and were mapped onto this one coronal brainstem section (-0.4 mm; adapted from Paxinos and Watson, 1997). Probes were placed bilaterally in each animal. The bilateral antisense perfusion sites (total on each side, n = 12; n = 6 each for experiments 1 and 2) are represented by solid red circles, the nonsense perfusion sites (total on each side, n = 10; n = 6 for experiment 1 and n = 4 for experiment 2) are represented by solid black circles, and the ACSF perfusion sites (n = 6 for experiment 2) are represented by solid blue circles. HDB, Nucleus of horizontal limb of the diagonal band; LPO, lateral preoptic nucleus; MCPO, magnocellular preoptic nucleus; SIB, substantia innominata basal; VP, ventral pallidum; VLPO, ventrolateral preoptic region. For identification of unlabeled structures, see Paxinos and Watson (1997). B, Representative photomicrograph of an antisense perfusion site in the cholinergic BF. The lesion (arrow) caused by the microdialysis probe is located in the midst of cholinergic neurons, the intact staining of which for ChAT indicates an absence of antisense-induced toxic effects on synthesis of this protein. Scale bar, 50 μm.
Figure 2.
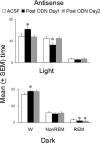
Effect of microdialys is perfusion of antisense oligonucleotides against the mRNA of the A1 receptor on spontaneous bouts of sleep-wakefulness in freely behaving animals during both the light period (top) and the dark period (bottom). During the control day (open bar), ACSF was perfused for 8 hr (from 10:00 A.M. to 6:00 P.M.). This was followed by microdialysis perfusion of antisense for 16 hr, delivered over 2d (8hr each day, from 10:00 A.M. to 6:00 P.M.). The top graph shows that, during the light period, there was a significant increase in wakefulness (p < 0.05; paired t test) and a significant decrease in non-REM sleep (p < 0.05; paired t test) on the first day after antisense perfusion (post-ODN day 1; solid bars) compared with the control (ACSF) day, whereas waking (W) and non-REM sleep were not different from control levels on post-ODN day 2 (gray bars). There was no effect on REM sleep. During the dark period (bottom), there was a significant (p < 0.05; paired t test) increase in wakefulness (W) but no change in non-REM sleep on post-ODN day 1 (solid bar) compared with control day (open bar), whereas both waking and non-REM sleep were not different from control levels on post-ODN day 2. There was a significant decrease in REM sleep (p < 0.05; paired t test) on both post-ODN day 1 and 2 (gray bar). For details, see Results. *p < 0.05.
Figure 3.
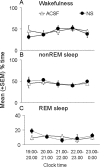
Absence of differences in the behavioral state effects of microdialysis perfusion of nonsense oligonucleotides against the mRNA of the adenosine A1 receptor (NS; solid circles) compared with ACSF perfusion (open triangles) during the first 5 hr of recovery sleep after 6 hr of sleep deprivation. Symbols indicate the mean ± SEM percentage of total time spent in wakefulness (A), non-REM sleep (B), and REM sleep (C). An hour-by-hour t test comparison for the two groups in each state showed no significant differences.
Figure 4.
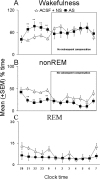
Increased wakefulness (A) and decreased non-REM sleep (B) effects of antisense oligonucleotides against the mRNA of the adenosine A1 receptor during the first 5 hr of the recovery sleep period (left part of each graph) after 6 hr of sleep deprivation compared with control animals (pooled ACSF and nonsense treatment groups, ACSF + NS). There was a significant increase in wakefulness and a decrease in non-REM sleep during the second, third, fourth, and fifth hours. REM sleep (C) did not show significant differences. The right part of the graphs (within box) shows that, for the subsequent 7 hr, there was no compensation for the antisense-induced changes in wakefulness and non-REM. Ordinate is mean ± SEM percentage of time spent in each behavioral state, and abscissa is time of day, with lights off occurring at 7:00 P.M. and lights on occurring at 7:00 A.M. **p < 0.01.
Figure 5.
EEG delta power (1–4 Hz, mean ± SEM) after sleep deprivation, expressed as percentage of each animal's delta power during the same time period on a nondeprivation day (previous day). Open triangles indicate control animals (ACSF and nonsense), and solid squares indicate antisense-treated animals. There was a significant decrease in delta activity in antisense-treated animals during all 5 hr of recovery sleep compared with the pooled controls (**p < 0.01). For details, see Results.
Figure 6.
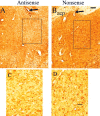
Effect of A1 receptor antisense ODN perfusion (A, C) compared with nonsense ODN perfusion (B, D) on A1 receptor immunoreactivity in the BF. Note the substantial suppression of A1 receptor immunoreactivity in and around the probe lesion site (black arrow) on the antisense-perfused side compared with the nonsense-perfused side (B; arrow, probe lesion site). The rectangular area in A and B is magnified and displayed in C and D. The cell bodies with A1 receptor immunoreactivity are clearly visible (D) in the side that received nonsense ODNs, whereas the side with antisense treatment (C) showed marked suppression of cell body A1 immunoreactivity, leaving fuzzy-appearing background activity. acp, Anterior commissure posterior part (Paxinos and Watson, 1997). Scale bars: A, B, 100 μm; C, D, 50 μm
Figure 7.
Effects of A1 receptor antisense perfusion on the integrity of neurons. A, Fluoro-Jade labeling is constrained to the immediate vicinity of the microdialysis probe track. This restricted location in and just around the track was present regardless of whether ACSF or antisense was perfused. B, Cresyl violet staining of a section 120 μm from the Fluoro-Jade section revealed the presence of intact neurons (arrows) outside the probe track. Scale bar, 20 μm.
Similar articles
- Adenosinergic modulation of basal forebrain and preoptic/anterior hypothalamic neuronal activity in the control of behavioral state.
Strecker RE, Morairty S, Thakkar MM, Porkka-Heiskanen T, Basheer R, Dauphin LJ, Rainnie DG, Portas CM, Greene RW, McCarley RW. Strecker RE, et al. Behav Brain Res. 2000 Nov;115(2):183-204. doi: 10.1016/s0166-4328(00)00258-8. Behav Brain Res. 2000. PMID: 11000420 - Adenosinergic inhibition of basal forebrain wakefulness-active neurons: a simultaneous unit recording and microdialysis study in freely behaving cats.
Thakkar MM, Delgiacco RA, Strecker RE, McCarley RW. Thakkar MM, et al. Neuroscience. 2003;122(4):1107-13. doi: 10.1016/j.neuroscience.2003.08.006. Neuroscience. 2003. PMID: 14643776 - Microdialysis perfusion of orexin-A in the basal forebrain increases wakefulness in freely behaving rats.
Thakkar MM, Ramesh V, Strecker RE, McCarley RW. Thakkar MM, et al. Arch Ital Biol. 2001 Apr;139(3):313-28. Arch Ital Biol. 2001. PMID: 11330208 - Adenosine and sleep-wake regulation.
Basheer R, Strecker RE, Thakkar MM, McCarley RW. Basheer R, et al. Prog Neurobiol. 2004 Aug;73(6):379-96. doi: 10.1016/j.pneurobio.2004.06.004. Prog Neurobiol. 2004. PMID: 15313333 Review. - [Adenosine in sleep regulation].
Adrien J. Adrien J. Rev Neurol (Paris). 2001 Nov;157(11 Pt 2):S7-11. Rev Neurol (Paris). 2001. PMID: 11924043 Review. French.
Cited by
- Chronic Astrocytic TNFα Production in the Preoptic-Basal Forebrain Causes Aging-like Sleep-Wake Disturbances in Young Mice.
Kostin A, Alam MA, Saevskiy A, Alam MN. Kostin A, et al. Cells. 2024 May 22;13(11):894. doi: 10.3390/cells13110894. Cells. 2024. PMID: 38891027 Free PMC article. - Effects of adenosine receptor overexpression and silencing in neurons and glial cells on lifespan, fitness, and sleep of Drosophila melanogaster.
Bhattacharya D, Górska-Andrzejak J, Abaquita TAL, Pyza E. Bhattacharya D, et al. Exp Brain Res. 2023 Jul;241(7):1887-1904. doi: 10.1007/s00221-023-06649-y. Epub 2023 Jun 19. Exp Brain Res. 2023. PMID: 37335362 Free PMC article. - Adenosine and P1 receptors: Key targets in the regulation of sleep, torpor, and hibernation.
Ma WX, Yuan PC, Zhang H, Kong LX, Lazarus M, Qu WM, Wang YQ, Huang ZL. Ma WX, et al. Front Pharmacol. 2023 Mar 10;14:1098976. doi: 10.3389/fphar.2023.1098976. eCollection 2023. Front Pharmacol. 2023. PMID: 36969831 Free PMC article. Review. - Translational approaches to influence sleep and arousal.
Brown RE, Spratt TJ, Kaplan GB. Brown RE, et al. Brain Res Bull. 2022 Jul;185:140-161. doi: 10.1016/j.brainresbull.2022.05.002. Epub 2022 May 10. Brain Res Bull. 2022. PMID: 35550156 Free PMC article. Review. - From Physiology to Pathology of Cortico-Thalamo-Cortical Oscillations: Astroglia as a Target for Further Research.
Gobbo D, Scheller A, Kirchhoff F. Gobbo D, et al. Front Neurol. 2021 Jun 9;12:661408. doi: 10.3389/fneur.2021.661408. eCollection 2021. Front Neurol. 2021. PMID: 34177766 Free PMC article. Review.
References
- Basheer R, Rainnie DG, Porkka-Heiskanen T, Ramesh V, McCarley RW ( 2001a) Adenosine, prolonged wakefulness, and A1-activated NF-kB DNA binding in the basal forebrain of the rat. Neuroscience 104: 731–739. - PubMed
- Basheer R, Halldner L, Alanko L, McCarley RW, Fredholm BB, Porkka-Heiskanen T ( 2001b) Opposite changes in adenosine A1 and A2A receptor mRNA in the rat following sleep deprivation. NeuroReport 12: 1577–1580. - PubMed
- Biggs TA, Myers RD ( 1997) Adenosine A1 receptor antisense infused in striatum of rats: actions on alcohol-induced locomotor impairment, blood alcohol, and body temperature. Alcohol 14: 617–621. - PubMed
Publication types
MeSH terms
Substances
Grants and funding
- K01MH01798/MH/NIMH NIH HHS/United States
- K01 MH001798-05/MH/NIMH NIH HHS/United States
- K01 MH001798/MH/NIMH NIH HHS/United States
- R37 MH039683/MH/NIMH NIH HHS/United States
- R37 MH039683-23/MH/NIMH NIH HHS/United States
- R37MH39683/MH/NIMH NIH HHS/United States
LinkOut - more resources
Full Text Sources
Other Literature Sources


