Molecular dynamics simulations of peptides and proteins with amplified collective motions - PubMed (original) (raw)
Comparative Study
Molecular dynamics simulations of peptides and proteins with amplified collective motions
Zhiyong Zhang et al. Biophys J. 2003 Jun.
Abstract
We present a novel method that uses the collective modes obtained with a coarse-grained model/anisotropic network model to guide the atomic-level simulations. Based on this model, local collective modes can be calculated according to a single configuration in the conformational space of the protein. In the molecular dynamics simulations, the motions along the slowest few modes are coupled to a higher temperature by the weak coupling method to amplify the collective motions. This amplified-collective-motion (ACM) method is applied to two test systems. One is an S-peptide analog. We realized the refolding of the denatured peptide in eight simulations out of 10 using the method. The other system is bacteriophage T4 lysozyme. Much more extensive domain motions between the N-terminal and C-terminal domain of T4 lysozyme are observed in the ACM simulation compared to a conventional simulation. The ACM method allows for extensive sampling in conformational space while still restricting the sampled configurations within low energy areas. The method can be applied in both explicit and implicit solvent simulations, and may be further applied to important biological problems, such as long timescale functional motions, protein folding/unfolding, and structure prediction.
Figures
FIGURE 1
Structures of the S-peptide analog. (a) Native structure. (b) Denatured structure after 20-ns MD simulation at 358 K (Zhang et al., 2001). The figures are created by MOLSCRIPT (Kraulis, 1991).
FIGURE 2
Root-mean-square deviations (RMSD) of backbone atoms between residues 4–12 in the S-peptide analog during some simulations. RMSD from the native structure (dotted lines); RMSD from the denatured structure (solid lines). (a) Conventional simulation beginning with the native structure (NA). (b) ACM simulation beginning with the native structure (NA_ACM). (c) Conventional simulation initiated with the denatured structure (UN). (d) ACM simulation initiated with the denatured structure (UN_ACM).
FIGURE 3
Potential energies in the simulations of the S-peptide analog. (a) NA (dotted line); NA_ACM (solid line). (b) UN (dotted line); UN_ACM (solid line). The energy values are averaged every 30 ps.
FIGURE 4
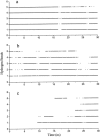
Forming and breaking of the five native hydrogen bonds (HB1-HB5) of the S-peptide analog during some simulations. (a) NA. (b) NA_ACM. (c) UN_ACM. A maximal distance of 0.25 nm between hydrogen and acceptor and a maximal angle of 60° between donor-hydrogen-acceptor were used. The numbering of hydrogen bonds: _Phe_8:NH-_Ala_4:CO (HB1); _Leu_9:NH-_Ala_5:CO (HB2); _Arg_10:NH-_Ala_6:CO (HB3); _Glu_11:NH-_Lys_7:CO (HB4); and _His_12:NH-_Phe_8:CO (HB5).
FIGURE 5
Some properties during the T4 lysozyme simulations. The control simulation S_300 (dotted lines) and the ACM simulation S_ACM (solid lines). (a) Root-mean-square fluctuations (RMSF) of C_α atoms from residues 1–162. (b) RMSD from the starting structure of the C_α atoms from residues 1–162. (c) RMSD of the C_α_ atoms of the N-terminal domain (residues 13–65). (d) RMSD of the C_α_ atoms of the C-terminal domain (residues 75–162).
FIGURE 6
Two-dimensional projections of the T4 lysozyme structures from x-ray and the two simulations onto the plane defined by the closure and the twist mode. 38 x-ray structures (solid circles). The initial structure of MD, 2LZM (arrow); trajectory of the _S_300 simulation (solid line); and trajectory of the _S_ACM simulation (dotted line).
FIGURE 7
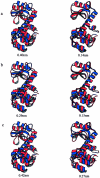
Superimposed structures indicating the observed domain motions of T4 lysozyme. From three set of structures: (a) x-ray structures, (b) conformations sampled in the usual MD simulation, and (c) conformations sampled in the ACM simulation; the structures with the maximum (red) and the minimum (blue) projections along the closure mode are superimposed on the left, and the structures with the maximum (red) and the minimum (blue) projections along the twist mode are superimposed on the right. RMS deviations of C_α_ atom positions between the superimposed structures are indicated under each set of the structures. The graphs have been created with MOLSCRIPT (Kraulis, 1991).
Similar articles
- Efficient characterization of collective motions and interresidue correlations in proteins by low-resolution simulations.
Bahar I, Erman B, Haliloglu T, Jernigan RL. Bahar I, et al. Biochemistry. 1997 Nov 4;36(44):13512-23. doi: 10.1021/bi971611f. Biochemistry. 1997. PMID: 9354619 Review. - Transform and relax sampling for highly anisotropic systems: application to protein domain motion and folding.
Kitao A. Kitao A. J Chem Phys. 2011 Jul 28;135(4):045101. doi: 10.1063/1.3613676. J Chem Phys. 2011. PMID: 21806159 - Characterization of protein flexibility using small-angle x-ray scattering and amplified collective motion simulations.
Wen B, Peng J, Zuo X, Gong Q, Zhang Z. Wen B, et al. Biophys J. 2014 Aug 19;107(4):956-64. doi: 10.1016/j.bpj.2014.07.005. Biophys J. 2014. PMID: 25140431 Free PMC article. - Domain motions in bacteriophage T4 lysozyme: a comparison between molecular dynamics and crystallographic data.
de Groot BL, Hayward S, van Aalten DM, Amadei A, Berendsen HJ. de Groot BL, et al. Proteins. 1998 May 1;31(2):116-27. doi: 10.1002/(sici)1097-0134(19980501)31:2<116::aid-prot2>3.0.co;2-k. Proteins. 1998. PMID: 9593186 - Revealing time bunching effect in single-molecule enzyme conformational dynamics.
Lu HP. Lu HP. Phys Chem Chem Phys. 2011 Apr 21;13(15):6734-49. doi: 10.1039/c0cp02860f. Epub 2011 Mar 15. Phys Chem Chem Phys. 2011. PMID: 21409227 Review.
Cited by
- Direct observation of T4 lysozyme hinge-bending motion by fluorescence correlation spectroscopy.
Yirdaw RB, McHaourab HS. Yirdaw RB, et al. Biophys J. 2012 Oct 3;103(7):1525-36. doi: 10.1016/j.bpj.2012.07.053. Epub 2012 Oct 2. Biophys J. 2012. PMID: 23062345 Free PMC article. - Molecular dynamics: survey of methods for simulating the activity of proteins.
Adcock SA, McCammon JA. Adcock SA, et al. Chem Rev. 2006 May;106(5):1589-615. doi: 10.1021/cr040426m. Chem Rev. 2006. PMID: 16683746 Free PMC article. Review. No abstract available. - Pre-existing soft modes of motion uniquely defined by native contact topology facilitate ligand binding to proteins.
Meireles L, Gur M, Bakan A, Bahar I. Meireles L, et al. Protein Sci. 2011 Oct;20(10):1645-58. doi: 10.1002/pro.711. Epub 2011 Sep 9. Protein Sci. 2011. PMID: 21826755 Free PMC article. Review. - SAXS-Oriented Ensemble Refinement of Flexible Biomolecules.
Cheng P, Peng J, Zhang Z. Cheng P, et al. Biophys J. 2017 Apr 11;112(7):1295-1301. doi: 10.1016/j.bpj.2017.02.024. Biophys J. 2017. PMID: 28402873 Free PMC article. - Modeling protein conformational changes by iterative fitting of distance constraints using reoriented normal modes.
Zheng W, Brooks BR. Zheng W, et al. Biophys J. 2006 Jun 15;90(12):4327-36. doi: 10.1529/biophysj.105.076836. Epub 2006 Mar 24. Biophys J. 2006. PMID: 16565046 Free PMC article.
References
- Abseher, R., and M. Nilges. 2000. Efficient sampling in collective coordinates space. Proteins. 39:82–88. - PubMed
- Amadei, A., A. B. M. Linssen, and H. J. C. Berendsen. 1993. Essential dynamics of proteins. Proteins. 17:412–425. - PubMed
- Amadei, A., A. B. M. Linssen, B. L. de Groot, D. M. F. van Aalten, and H. J. C. Berendsen. 1996. An efficient method for sampling the essential subspace of proteins. J. Biomol. Struct. Dyn. 13:615–625. - PubMed
- Anderson, W. F., M. G. Grutter, S. J. Remington, L. H. Weaver, and B. W. Matthews. 1981. Crystallographic determination of the mode of binding of oligosaccharides to T4 bacteriophage lysozyme: implications for the mechanism of catalysis. J. Mol. Biol. 147:523–543. - PubMed
Publication types
MeSH terms
Substances
LinkOut - more resources
Full Text Sources
Other Literature Sources


