Developmentally regulated recruitment of transcription factors and chromatin modification activities to chicken lysozyme cis-regulatory elements in vivo - PubMed (original) (raw)
Developmentally regulated recruitment of transcription factors and chromatin modification activities to chicken lysozyme cis-regulatory elements in vivo
Pascal Lefevre et al. Mol Cell Biol. 2003 Jun.
Abstract
Expression of the chicken lysozyme gene is upregulated during macrophage differentiation and reaches its highest level in bacterial lipopolysaccharide (LPS)-stimulated macrophages. This is accompanied by complex alterations in chromatin structure. We have previously shown that chromatin fine-structure alterations precede the onset of gene expression in macrophage precursor cells and mark the lysozyme chromatin domain for expression later in development. To further examine this phenomenon and to investigate the basis for the differentiation-dependent alterations of lysozyme chromatin, we studied the recruitment of transcription factors to the lysozyme locus in vivo at different stages of myeloid differentiation. Factor recruitment occurred in several steps. First, early-acting transcription factors such as NF1 and Fli-1 bound to a subset of enhancer elements and recruited CREB-binding protein. LPS stimulation led to an additional recruitment of C/EBPbeta and a significant change in enhancer and promoter structure. Transcription factor recruitment was accompanied by specific changes in histone modification within the lysozyme chromatin domain. Interestingly, we present evidence for a transient interaction of transcription factors with lysozyme chromatin in lysozyme-nonexpressing macrophage precursors, which was accompanied by a partial demethylation of CpG sites. This indicates that a partially accessible chromatin structure of lineage-specific genes is a hallmark of hematopoietic progenitor cells.
Figures
FIG. 1.
Map of the chicken lysozyme locus and cell lines used in this study. The left panel indicates the cell lines used, their position in the myeloid hierarchy, and the level of lysozyme expression in these cells as (−) or (+). The right panel depicts the 5′ regulatory region of the locus and the position of _cis_-regulatory elements relative to the transcription start (black rectangles). E, enhancer; P, promoter; S, silencer; H, hormone response element. The black vertical arrows indicate the position of DNase I-hypersensitive sites (DHSs) in the different cell lines. The switch in the DNase I-hypersensitive site pattern in the −2.4-kb/−2.7-kb region is indicated by a decrease or increase in shading. A constitutive DNase I-hypersensitive site at −7.9 kb is indicated as a speckled arrow. The transcription start is indicated by a horizontal arrow, and the first two exons are depicted as speckled boxes.
FIG. 2.
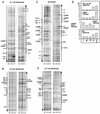
In vivo DMS footprinting of the early enhancers at −6.1 kb (A) and −3.9 kb (B), the promoter (C), and the −2.7-kb enhancer (D) in the different cell lines. The positions of known transcription factor binding sites and their natures are indicated as white boxes at the left (lower strand) or the right (upper strand). Alterations in G(N7) reactivity are indicated as white (protection) or black (enhancement) circles. Only alterations that were seen in more than one experiment are highlighted. Asterisks indicate LPS-responsive alterations. Lane G, naked DNA; lane 1, HD37; lane 2, HD50 MEP; lane 3, HD11; lane 4, HD11 plus LPS. (E) Quantification of relative band intensity at selected transcription factor binding sites in different cell types as indicated and naked DNA (G). (us), upper strand; (ls), lower strand. Please note that we recently completed the sequence of the entire lysozyme locus and that the coordinates have been revised from previous publications.
FIG. 3.
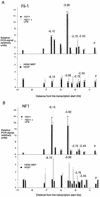
Chromatin immunoprecipitation assay examining transcription factor binding to the lysozyme 5′ regulatory region with antibodies against Fli-1 (A) or NF1 (B) in HD50 MEP, HD37, HD11, and LPS-treated HD11 cells. The relative enrichment was calculated by normalizing the PCR signals to that of the −10.07-kb primer and the β-actin control primer as described in the text. The hatched bars in the lower panel refer to a control experiment in HD50 MEP cells in which chromatin was not cross-linked. The data are plotted as mean value of at least two independent chromatin immunoprecipitation assays and three independent amplifications.
FIG. 4.
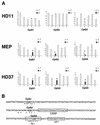
DNA methylation at the −3.9-kb enhancer. Genomic DNA from the indicated cell lines was subjected to bisulfite modification and analyzed by bulk sequencing as described in the text. (A) Peaks from a sequencing reaction indicating cytosines and thymines at CpGs 1, 2, and 3 were quantified and are displayed as black and grey bars, respectively. Differentially modified C's that are part of a CpG are indicated by an asterisk. (B) Sequence of the 5′ part of the 3.9-kb enhancer indicating the positions of T's (not modified) or C's (modified) or the central CpG that contains a C which is differentially modified. The positions of CpGs 1 to 3 and of the transcription factor binding sites are indicated.
FIG. 5.
Chromatin immunoprecipitation assay examining transcription factor binding to the lysozyme 5′ regulatory region with antibodies against C/EBPβ (NF-M) in HD50 MEP, HD11, and LPS-treated HD11 cells as indicated. The relative enrichment was calculated by normalizing the PCR signals to that of the −10.07-kb primer and the β-actin control primer as described in the text. The data are plotted as mean value of at least two independent chromatin immunoprecipitation assays and three independent amplifications.
FIG. 6.
Chromatin immunoprecipitation assay examining transcription factor binding to the lysozyme 5′ regulatory region with antibodies against CBP in HD50 MEP, HD11 and LPS-treated HD11 cells as indicated. The relative enrichment was calculated by normalizing the PCR signals to that of the −10.07 kb primer and the β-actin control primer as described in the text. The data are plotted as mean value of at least two independent chromatin immunoprecipitation assays and three independent amplifications.
FIG. 7.
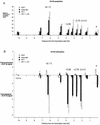
Chromatin immunoprecipitation assay examining the histone H3 modification status in HD37, HD50 MEP, HD11, and LPS-treated HD11 cells as indicated. (A) Chromatin immunoprecipitation assay with antibodies recognizing histone H3 lysine 9 acetylation. The relative enrichment was calculated by normalizing the PCR signals to that of a β-actin control primer as described in the text. Note therefore that the ratio of β-actin to −10.07-kb signal intensity is constant. (B) Chromatin immunoprecipitation assay with antibodies recognizing methylated histone H3 lysine 9. In this case the relative enrichment or depletion was calculated by normalizing the PCR signals to that of the −10.07-kb primer as described in the text. The levels of histone H3 methylation at the boundaries of the DNase I-sensitive domain at −10.07 kb in the different cell lines are the same, as determined by normalization to signals obtained with the β-actin primer. The β-actin primer yielded signals that were two- to threefold lower that those obtained with the −10.07-kb primer (data not shown). The data are plotted as mean value of at least two independent chromatin immunoprecipitation assays and three independent amplifications.
FIG. 8.
Different steps in lysozyme locus activation. Summary of changes in chromatin structure, transcription factor occupancy, and cofactor recruitment in the chicken lysozyme 5′ regulatory region in HD37 erythroblasts, HD50 MEP precursor cells, as well as unstimulated and LPS-stimulated HD11 cells (not to scale). White shapes represent transcription factors binding to the enhancer cores, the promoter, and the −2.4-kb silencer. TR, thyroid hormone receptor, binding to the −2.4-kb silencer next to the CTCF site (4). Methyl groups (CH3) indicate DNA methylation, and acetyl groups (Ac) indicate histone acetylation. Grey circles represent nucleosomes. Shapes with dashed lines indicate transcription factor complexes which are not present in every cell or become stabilized after LPS stimulation. Black vertical arrows indicate strong DNase I-hypersensitive sites, and grey arrows indicate weak DNase I-hypersensitive sites.
Similar articles
- Differentiation-dependent alterations in histone methylation and chromatin architecture at the inducible chicken lysozyme gene.
Lefevre P, Lacroix C, Tagoh H, Hoogenkamp M, Melnik S, Ingram R, Bonifer C. Lefevre P, et al. J Biol Chem. 2005 Jul 29;280(30):27552-60. doi: 10.1074/jbc.M502422200. Epub 2005 May 27. J Biol Chem. 2005. PMID: 15923188 - Identification of factors mediating the developmental regulation of the early acting -3.9 kb chicken lysozyme enhancer element.
Lefevre P, Kontaraki J, Bonifer C. Lefevre P, et al. Nucleic Acids Res. 2001 Nov 15;29(22):4551-60. doi: 10.1093/nar/29.22.4551. Nucleic Acids Res. 2001. PMID: 11713304 Free PMC article. - Regulation of the chicken lysozyme locus in transgenic mice.
Bonifer C, Huber MC, Faust N, Sippel AE. Bonifer C, et al. Crit Rev Eukaryot Gene Expr. 1996;6(2-3):285-97. doi: 10.1615/critreveukargeneexpr.v6.i2-3.90. Crit Rev Eukaryot Gene Expr. 1996. PMID: 8855392 Review. - Prerequisites for tissue specific and position independent expression of a gene locus in transgenic mice.
Bonifer C, Huber MC, Jägle U, Faust N, Sippel AE. Bonifer C, et al. J Mol Med (Berl). 1996 Nov;74(11):663-71. doi: 10.1007/s001090050070. J Mol Med (Berl). 1996. PMID: 8956152 Review.
Cited by
- The mechanism of repression of the myeloid-specific c-fms gene by Pax5 during B lineage restriction.
Tagoh H, Ingram R, Wilson N, Salvagiotto G, Warren AJ, Clarke D, Busslinger M, Bonifer C. Tagoh H, et al. EMBO J. 2006 Mar 8;25(5):1070-80. doi: 10.1038/sj.emboj.7600997. Epub 2006 Feb 16. EMBO J. 2006. PMID: 16482219 Free PMC article. - Early chromatin unfolding by RUNX1: a molecular explanation for differential requirements during specification versus maintenance of the hematopoietic gene expression program.
Hoogenkamp M, Lichtinger M, Krysinska H, Lancrin C, Clarke D, Williamson A, Mazzarella L, Ingram R, Jorgensen H, Fisher A, Tenen DG, Kouskoff V, Lacaud G, Bonifer C. Hoogenkamp M, et al. Blood. 2009 Jul 9;114(2):299-309. doi: 10.1182/blood-2008-11-191890. Epub 2009 Apr 1. Blood. 2009. PMID: 19339695 Free PMC article. - Pioneer factors in embryonic stem cells and differentiation.
Smale ST. Smale ST. Curr Opin Genet Dev. 2010 Oct;20(5):519-26. doi: 10.1016/j.gde.2010.06.010. Epub 2010 Jul 16. Curr Opin Genet Dev. 2010. PMID: 20638836 Free PMC article. Review. - Developmental activation of the lysozyme gene in chicken macrophage cells is linked to core histone acetylation at its enhancer elements.
Myers FA, Lefevre P, Mantouvalou E, Bruce K, Lacroix C, Bonifer C, Thorne AW, Crane-Robinson C. Myers FA, et al. Nucleic Acids Res. 2006;34(14):4025-35. doi: 10.1093/nar/gkl543. Epub 2006 Aug 16. Nucleic Acids Res. 2006. PMID: 16914441 Free PMC article. - The Pu.1 locus is differentially regulated at the level of chromatin structure and noncoding transcription by alternate mechanisms at distinct developmental stages of hematopoiesis.
Hoogenkamp M, Krysinska H, Ingram R, Huang G, Barlow R, Clarke D, Ebralidze A, Zhang P, Tagoh H, Cockerill PN, Tenen DG, Bonifer C. Hoogenkamp M, et al. Mol Cell Biol. 2007 Nov;27(21):7425-38. doi: 10.1128/MCB.00905-07. Epub 2007 Sep 4. Mol Cell Biol. 2007. PMID: 17785440 Free PMC article.
References
- Ahne, B., and W. H. Strätling. 1994. Characterization of a myeloid-specific enhancer of the chicken lysozyme gene. J. Biol. Chem. 269:17794-17801. - PubMed
- Alevizopoulos, A., Y. Dusserre, M. Tsai-Pflugfelder, T. von der Weid, W. Wahli, and N. Mermod. 1995. A proline-rich TGF-beta-responsive transcriptional activator interacts with histone H3. Genes Dev. 9:3051-3066. - PubMed
- Baniahmad, A., C. Steiner, A. C. Kohne, and R. Renkawitz. 1990. Modular structure of a chicken lysozyme silencer: involvement of an unusual thyroid hormone receptor binding site. Cell 61:505-514. - PubMed
- Bell, A. C., A. G. West, and G. Felsenfeld. 1999. The protein CTCF is required for the enhancer blocking activity of vertebrate insulators. Cell 98:387-396. - PubMed
Publication types
MeSH terms
Substances
LinkOut - more resources
Full Text Sources
Research Materials
Miscellaneous


