Predicting survival in patients with metastatic kidney cancer by gene-expression profiling in the primary tumor - PubMed (original) (raw)
. 2003 Jun 10;100(12):6958-63.
doi: 10.1073/pnas.1131754100. Epub 2003 May 30.
Joanna H Shih, Shuba R Iyengar, Jodi Maranchie, Joseph Riss, Robert Worrell, Carlos Torres-Cabala, Ray Tabios, Andra Mariotti, Robert Stearman, Maria Merino, McClellan M Walther, Richard Simon, Richard D Klausner, W Marston Linehan
Affiliations
- PMID: 12777628
- PMCID: PMC165812
- DOI: 10.1073/pnas.1131754100
Predicting survival in patients with metastatic kidney cancer by gene-expression profiling in the primary tumor
James R Vasselli et al. Proc Natl Acad Sci U S A. 2003.
Abstract
To identify potential molecular determinants of tumor biology and possible clinical outcomes, global gene-expression patterns were analyzed in the primary tumors of patients with metastatic renal cell cancer by using cDNA microarrays. We used grossly dissected tumor masses that included tumor, blood vessels, connective tissue, and infiltrating immune cells to obtain a gene-expression "profile" from each primary tumor. Two patterns of gene expression were found within this uniformly staged patient population, which correlated with a significant difference in overall survival between the two patient groups. Subsets of genes most significantly associated with survival were defined, and vascular cell adhesion molecule-1 (VCAM-1) was the gene most predictive for survival. Therefore, despite the complex biological nature of metastatic cancer, basic clinical behavior as defined by survival may be determined by the gene-expression patterns expressed within the compilation of primary gross tumor cells. We conclude that survival in patients with metastatic renal cell cancer can be correlated with the expression of various genes based solely on the expression profile in the primary kidney tumor.
Figures
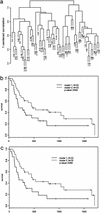
Fig. 1.
Unsupervised dendrogram and resulting survival curves. (a) Dendrogram created by unsupervised clustering demonstrating two major groups of patients. (b) Kaplan–Meier survival curve based on the two groups of patients from a. (c) Survival curve from b depicting patients with <0.5 Pearson correlation between arrays removed.
Fig. 2.
Cluster matrix of 45 genes most significantly associated with survival. The colors in the matrix represent a maximum of 2-fold up-regulation (brightest yellow) or 2-fold down-regulation (brightest blue) relative to the median for each gene. The patients (columns) are labeled by patient number followed by the number of days alive after nephrectomy. The bar graph below the matrix graphically depicts the length of patient survival; red bars represent patients who are still alive. The dendrogram above the patient list graphically depicts the two major patient groups and minor subgroups within the two larger groups.
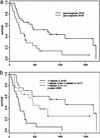
Fig. 3.
Survival curves based on supervised analysis. (a) Kaplan–Meier plots of overall survival of 58 patients grouped into good prognosis and poor prognosis by their gene-expression outcome predictor generated by the leave-one-out cross-validated procedure. (b) Survival curves of patients grouped by the median of log ratio +0.5 and –0.5 for VCAM-1.
Similar articles
- MicroRNAs with prognostic potential for metastasis in clear cell renal cell carcinoma: a comparison of primary tumors and distant metastases.
Heinzelmann J, Unrein A, Wickmann U, Baumgart S, Stapf M, Szendroi A, Grimm MO, Gajda MR, Wunderlich H, Junker K. Heinzelmann J, et al. Ann Surg Oncol. 2014 Mar;21(3):1046-54. doi: 10.1245/s10434-013-3361-3. Epub 2013 Nov 18. Ann Surg Oncol. 2014. PMID: 24242678 - Gene expression in kidney cancer is associated with cytogenetic abnormalities, metastasis formation, and patient survival.
Sültmann H, von Heydebreck A, Huber W, Kuner R, Buness A, Vogt M, Gunawan B, Vingron M, Füzesí L, Poustka A. Sültmann H, et al. Clin Cancer Res. 2005 Jan 15;11(2 Pt 1):646-55. Clin Cancer Res. 2005. PMID: 15701852 - MicroRNA profile in stage I clear cell renal cell carcinoma predicts progression to metastatic disease.
Moynihan MJ, Sullivan TB, Burks E, Schober J, Calabrese M, Fredrick A, Kalantzakos T, Warrick J, Canes D, Raman JD, Rieger-Christ K. Moynihan MJ, et al. Urol Oncol. 2020 Oct;38(10):799.e11-799.e22. doi: 10.1016/j.urolonc.2020.05.006. Epub 2020 Jun 10. Urol Oncol. 2020. PMID: 32534961 - [Microarrays for the identification of molecular markers in the diagnosis and therapy of renal cell carcinomas].
Sültmann H, Poustka A. Sültmann H, et al. Urologe A. 2006 Mar;45(3):297-8, 300-4. doi: 10.1007/s00120-006-1003-0. Urologe A. 2006. PMID: 16465525 Review. German. - [DNA and microRNA microarray technologies in diagnostics and prediction for patients with renal cell carcinoma].
Slabý O, Svoboda M, Michálek J, Vyzula R. Slabý O, et al. Klin Onkol. 2009;22(5):202-9. Klin Onkol. 2009. PMID: 19886357 Review. Czech.
Cited by
- Cancer association study of aminoacyl-tRNA synthetase signaling network in glioblastoma.
Kim YW, Kwon C, Liu JL, Kim SH, Kim S. Kim YW, et al. PLoS One. 2012;7(8):e40960. doi: 10.1371/journal.pone.0040960. Epub 2012 Aug 31. PLoS One. 2012. PMID: 22952576 Free PMC article. - A Molecular Model for Predicting Overall Survival in Patients with Metastatic Clear Cell Renal Carcinoma: Results from CALGB 90206 (Alliance).
Kim HL, Halabi S, Li P, Mayhew G, Simko J, Nixon AB, Small EJ, Rini B, Morris MJ, Taplin ME, George D; Alliance for Clinical Trials in Oncology. Kim HL, et al. EBioMedicine. 2015 Sep 8;2(11):1814-20. doi: 10.1016/j.ebiom.2015.09.012. eCollection 2015 Nov. EBioMedicine. 2015. PMID: 26870806 Free PMC article. - Prognostic and predictive biomarkers in renal cell carcinoma.
Vickers MM, Heng DY. Vickers MM, et al. Target Oncol. 2010 Jun;5(2):85-94. doi: 10.1007/s11523-010-0143-8. Epub 2010 Jun 28. Target Oncol. 2010. PMID: 20582732 Review. - Staging of renal cell carcinoma: Current concepts.
Lam JS, Klatte T, Breda A. Lam JS, et al. Indian J Urol. 2009 Oct-Dec;25(4):446-54. doi: 10.4103/0970-1591.57906. Indian J Urol. 2009. PMID: 19955666 Free PMC article. - Expression of human chorionic gonadotropin beta-subunit type I genes predicts adverse outcome in renal cell carcinoma.
Hotakainen K, Lintula S, Ljungberg B, Finne P, Paju A, Stenman UH, Stenman J. Hotakainen K, et al. J Mol Diagn. 2006 Nov;8(5):598-603. doi: 10.2353/jmoldx.2006.060076. J Mol Diagn. 2006. PMID: 17065429 Free PMC article.
References
- American Cancer Society (2002) Cancer Facts and Figures (Am. Cancer Soc., Atlanta).
- Vasselli, J. R., Yang, J. C., Linehan, W. M., White, D. E., Rosenberg, S. A. & Walther, M. M. (2001) J. Urol. 166, 68–72. - PubMed
- Wagner, J. R., Walther, M. M., Linehan, W. M., White, D. E., Rosenberg, S. A. & Yang, J. C. (1999) J. Urol. 162, 43–45. - PubMed
- Yang, J. C. & Rosenberg, S. A. (1997) Cancer J. Sci. Am. 3, Suppl. 1, S79–S84. - PubMed
- Lee, D. S., White, D. E., Hurst, R., Rosenberg, S. A. & Yang, J. C. (1998) Cancer J. Sci. Am. 4, 86–93. - PubMed
MeSH terms
Substances
LinkOut - more resources
Full Text Sources
Other Literature Sources
Medical
Miscellaneous


