Loss of circadian rhythmicity in aging mPer1-/-mCry2-/- mutant mice - PubMed (original) (raw)
Loss of circadian rhythmicity in aging mPer1-/-mCry2-/- mutant mice
Henrik Oster et al. Genes Dev. 2003.
Abstract
The mPer1, mPer2, mCry1, and mCry2 genes play a central role in the molecular mechanism driving the central pacemaker of the mammalian circadian clock, located in the suprachiasmatic nuclei (SCN) of the hypothalamus. In vitro studies suggest a close interaction of all mPER and mCRY proteins. We investigated mPER and mCRY interactions in vivo by generating different combinations of mPer/mCry double-mutant mice. We previously showed that mCry2 acts as a nonallelic suppressor of mPer2 in the core clock mechanism. Here, we focus on the circadian phenotypes of mPer1/mCry double-mutant animals and find a decay of the clock with age in mPer1-/- mCry2-/- mice at the behavioral and the molecular levels. Our findings indicate that complexes consisting of different combinations of mPER and mCRY proteins are not redundant in vivo and have different potentials in transcriptional regulation in the system of autoregulatory feedback loops driving the circadian clock.
Figures
Figure 1.
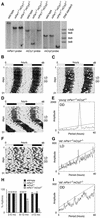
Generation of mPer1mCry double-mutant mice and representative locomotor activity records. (A) Southern blot analysis of wild-type,_mPer1_-/- _mCry1_-/-, and_mPer1_-/- mCry2_-/- tail DNA. The_mPer1 probe hybridizes to a 20-kb wild-type and a 11.8-kb mutant fragment of _Eco_RI-digested genomic DNA. The mCry1 probe detects a 9-kb wild-type and a 4-kb _Nco_I-digested fragment of the targeted locus. In mCry2 mutants, the wild-type allele is detected by hybridization of the probe to a 7-kb _Eco_RI fragment, whereas the mutant allele yields a 3.5-kb fragment. (B_–_D,F) Representative locomotor activity records of wild-type (B),_mPer1_-/- _mCry1_-/- (C), young_mPer1_-/- _mCry2_-/- (D), and old _mPer1_-/- _mCry2_-/- (F) animals kept in a 12-h light/12-h dark (LD) cycle and in constant darkness (DD; transition indicated by the horizontal line). Activity is represented by black bars and is double-plotted with the activity of the following light/dark cycle plotted to the right and below the previous light/dark cycle. The top bar indicates light and dark phases in LD. For the first 5 d in DD, wheel rotations per day were 20,000 ± 2500 (n = 17) for wild-type animals, 21,500 ± 7300 (n = 15) for_mPer1_-/- _mCry1_-/- mutants, 25,100 ± 6200 (n = 14) for young _mPer1_-/- _mCry2_-/- mutants, and 17,200 + 7900 (n = 9) for old _mPer1_-/- _mCry2_-/- mutants. (E,G,I) Periodogram analysis of young _mPer1_-/- _mCry2_-/- animals in DD (E corresponds to activity plot in D), and old mPer1_-/- mCry2_-/- animals in LD (G corresponds to activity plot in F) and DD (I corresponds to activity plot in_F). Analysis was performed on 10 consecutive days in LD or DD after animals were allowed to adapt 5 d to the new light regimen. The ascending straight line in the periodograms represents a statistical significance of_p < 0.001 as determined by the ClockLab program. (_H_) Age dependence of rhythmicity in wild-type (dark gray bar),_mPer1_-/- (white bar), _mCry2_-/- (black bar), and _mPer1_-/- _mCry2_-/- (light gray bar) mice. The animals tested were divided into three groups according to their age (2–6 mo, 6–12mo, and >12 mo old). Rhythmicity in DD was determined by periodogram analysis. The values on top of each bar indicate the total numbers of animals tested per group and genotype.
Figure 2.
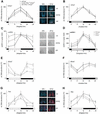
mPer2 mRNA and mPER2 protein expression profiles of young and old_mPer1_-/- _mCry2_-/- mice. (A) Diurnal expression of mPer2 in the SCN of wild-type (solid line), young _mPer1_-/- _mCry2_-/- (dotted line), and old mPer1_-/- mCry2_-/- (dashed line) mice in LD. In old double mutants, mPer2 cycling is significantly dampened (p < 0.05). The black and white bars on the_X_-axis indicate the dark and light phases, respectively. All data presented are mean ± S.D. for three different experiments. (Right panels) Representative micrographs of SCN probed with an_mPer2 antisense probe at time points of minimal(ZT0) and maximal(ZT12) expression. Tissue was visualized by Hoechst dye nuclear staining (blue); silver grains are artificially colored (red) for clarification. Bar, 200 μm. (B) Circadian expression of_mPer2 in the SCN of wild-type (solid line) and young_mPer1_-/- _mCry2_-/- (dotted line) mice on the fourth day in DD. Gray and black bars on the _X_-axis indicate subjective day and night, respectively. (C) Diurnal variation of mPER2 immunoreactivity in the SCN of wild-type (solid line), young_mPer1_-/- _mCry2_-/- (dotted line), and old _mPer1_-/- _mCry2_-/- (dashed line) mice in LD. Quantification was performed by counting immunoreactive nuclei in the area of the SCN. In old double mutants, oscillation of mPER2 immunoreactivity is significantly dampened (p < 0.05) with medium numbers of immunoreactive nuclei. (Right panels) Representative micrographs of immunostained SCN at time points of minimal(ZT0) and maximal(ZT12) immunoreactivity. Bar, 100 μm. (D) Quantified Northern analysis of diurnal expression of mPer2 in the kidney of wild-type (solid line), young _mPer1_-/- _mCry2_-/- (dotted line), and old_mPer1_-/- _mCry2_-/- (dashed line) mice in LD. (E) Representative Northern blot from kidney tissue from wild-type (left), young _mPer1_-/- _mCry2_-/- (middle), and old_mPer1_-/- mCry2_-/- (right) mice sequentially hybridized with mPer2 (top row) and_Gapdh (bottom row) antisense probes. The black and white bars below the blots indicate dark and light phase, respectively.
Figure 3.
mCry1 and Bmal1 mRNA, and mCRY1 protein expression profiles of wild-type (solid line), young _mPer1_-/- _mCry2_-/- (dotted line), and old_mPer1_-/- _mCry2_-/- (dashed line) mice. (A) Diurnal expression of mCry1 in the SCN in LD. The black and white bars on the X_-axis indicate dark and light phases, respectively. (Right panels) Representative micrographs of SCN probed with the mCry1 antisense probe at time points of minimal(ZT0) and maximal(ZT12) expression. Bar, 200 μm. (B) Circadian expression of_mCry1 in the SCN on the fourth day in DD. The gray and black bars on the _X_-axis indicate subjective day and night, respectively. (C) Diurnal variation of mCRY1 immunoreactivity in the SCN in LD. Quantification was performed by counting immunoreactive nuclei in the area of the SCN. In old double mutants, oscillation of mCRY1 immunoreactivity is significantly dampened (p < 0.05), with constantly high numbers of immunoreactive nuclei throughout the LD cycle. (Right panels) Representative micrographs of immunostained SCN at time points of minimal(ZT0) and maximal(ZT12) immunoreactivity. Bar, 100 μm. (D) Diurnal expression of mCRY1 protein in the SCN of wild-type (solid line),_mPer1_-/- (dotted line), and _mCry2_-/- (hatched line) mice. (E) Diurnal variation of Bmal1 mRNA expression in the SCN in LD. In old double mutants, Bmal1 cycling is significantly dampened (p < 0.05). (F) Circadian expression of Bmal1 mRNA in the SCN on the fourth day in DD. (G) Diurnal time course of Avp mRNA expression in the SCN in LD. (H) Diurnal time course of Dbp mRNA expression in the SCN in LD. Tissue was visualized by Hoechst dye nuclear staining (blue); silver grains are artificially colored (red) for clarification. All data presented are mean ± S.D. for three different experiments.
Figure 4.
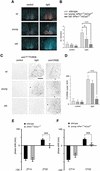
Light responsiveness in the SCN of young and old_mPer1_-/- _mCry2_-/- mice. (A) In situ hybridization analysis of mPer2 light inducibility in the SCN of wild-type (wt, top row), young _mPer1_-/- _mCry2_-/- (middle row), and old_mPer1_-/- _mCry2_-/- mice (bottom row). Shown are representative micrographs of SCN probed with an mPer2 antisense probe with (light) or without light administration (control) at ZT14 (15-min light pulse, 400 lx; animals were sacrificed 1 h later). Tissue was visualized by Hoechst dye nuclear staining (blue); silver grains are artificially colored (red) for clarification. Bar, 200 μm. (B) Quantification of mPer2 induction after a light pulse at Z14. (Left panel) Control animals without light exposure. (Right panel) Relative mPer2 mRNA induction after light exposure (wild-type control was set as 1). Data presented are mean ± S.D. of three different animals each. Statistical significance is indicated by asterisks (*, p < 0.05; ***, p < 0.001). (C) Immunohistochemistry analysis of CREB Ser 133 phosphorylation by light in the SCN of wild-type (wt, top row), young _mPer1_-/- _mCry2_-/- (middle row), and old_mPer1_-/- _mCry2_-/- mice (bottom row). Shown are representative micrographs of SCN sections immunostained for Ser133P-CREB with (light) or without light administration (control) at ZT14. As a control, SCN sections for all genotypes were stained for CREB (unphosphorylated) at the same time points. (D) Quantification of CREB phosphorylation after a light pulse at ZT14. Panels show numbers of Ser133P-CREB immunoreactive nuclei in the SCN with or without light exposure (***, p < 0.001). (E) Light-induced phase shifts in _mPer1_-/- _mCry1_-/- mice using the Aschoff Type II protocol to assess phase shifts. Animals were kept for at least 10 d in LD and released into DD after a light pulse at ZT14 or ZT22. Negative values indicate phase delays; positive values indicate phase advances. The data presented are mean ± S.D. of 10–14 animals (***, p < 0.001). (F) Light-induced phase shifts in young _mPer1_-/- _mCry2_-/- mice using the Aschoff Type I protocolto assess phase shifts. Animals were kept for at least 10 d in DD before a light pulse at CT14 or CT22. Data presented are mean ± S.D. of 10–13 animals.
Figure 5.
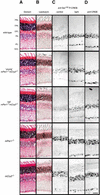
Histology and light responsiveness in the retina of wild-type, young, and old _mPer1_-/- _mCry2_-/- mice. Gomori trichrome (A) and lipofuscin (B) staining of retinal sections of wild-type (first row), young _mPer1_-/- _mCry2_-/- (second row), old_mPer1_-/- _mCry2_-/- (third row), _mPer1_-/- (fourth row), and_mCry2_-/- mice (fifth row). Retinal layers are indicated on the left. PRL, potoreceptor layer; ONL, outer nuclear layer; OPL, outer plexiform layer; INL, inner nuclear layer; IPL, inner plexiform layer; GCL, ganglion cell layer. (C) Immunohistochemistry analysis of light-induced CREB Ser 133 phosphorylation in the retina. (Left panels) Immunostained retinal sections of control animals without light exposure. (Right panels) Animals 1 h after light exposure (400 lx, 15 min) at ZT14. (D) Immunohistochemistry analysis for (unphosphorylated) CREB in the retina at ZT14. Bar, 10 μm.
Figure 6.
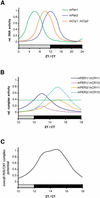
Working model for PER/CRY-driven inhibition of CLOCK/BMAL1. (A)mPer and mCry transcripts show diurnal/circadian cycling in the SCN. Whereas mPer1 expression peaks between ZT/CT 4 and 8,mCry1 and mPer2 mRNA rhythms have their maxima at ZT/CT10 to ZT/CT12, respectively. Note that mCry2 is also expressed in the SCN but without a clearly defined rhythm. Protein peaks are delayed by ∼4–6 h with regard to mRNA. (B) mPER and mCRY proteins form heteromeric complexes that form with certain preferences according to protein–protein affinity and temporal abundance. The complexes are color coded, with mPER1/mCRY1 and mPER2/mCRY2 representing the most abundant ones. The green horizontal line indicates a threshold above which a PER/CRY complex is abundant enough to influence CLOCK/BMAL1 transcription. (C) Time course of the overall inhibitory potential of the mPER/mCRY heteromers on CLOCK/BMAL1 activity. The strong inhibition of CLOCK/BMAL1 during (subjective) night corresponds to the low transcriptional activity of (CLOCK/BMAL1-induced)mPer and mCry genes.
Similar articles
- Daily variation of clock output gene activation in behaviorally arrhythmic mPer/mCry triple mutant mice.
Oster H, van der Horst GT, Albrecht U. Oster H, et al. Chronobiol Int. 2003 Jul;20(4):683-95. doi: 10.1081/cbi-120022408. Chronobiol Int. 2003. PMID: 12916720 - Disruption of mCry2 restores circadian rhythmicity in mPer2 mutant mice.
Oster H, Yasui A, van der Horst GT, Albrecht U. Oster H, et al. Genes Dev. 2002 Oct 15;16(20):2633-8. doi: 10.1101/gad.233702. Genes Dev. 2002. PMID: 12381662 Free PMC article. - Analysis of clock proteins in mouse SCN demonstrates phylogenetic divergence of the circadian clockwork and resetting mechanisms.
Field MD, Maywood ES, O'Brien JA, Weaver DR, Reppert SM, Hastings MH. Field MD, et al. Neuron. 2000 Feb;25(2):437-47. doi: 10.1016/s0896-6273(00)80906-x. Neuron. 2000. PMID: 10719897 - Cellular and molecular basis of circadian timing in mammals.
Reppert SM. Reppert SM. Semin Perinatol. 2000 Aug;24(4):243-6. doi: 10.1053/sper.2000.9122. Semin Perinatol. 2000. PMID: 10975430 Review. - Cryptochrome: the second photoactive pigment in the eye and its role in circadian photoreception.
Sancar A. Sancar A. Annu Rev Biochem. 2000;69:31-67. doi: 10.1146/annurev.biochem.69.1.31. Annu Rev Biochem. 2000. PMID: 10966452 Review.
Cited by
- Cryptochrome restores dampened circadian rhythms and promotes healthspan in aging Drosophila.
Rakshit K, Giebultowicz JM. Rakshit K, et al. Aging Cell. 2013 Oct;12(5):752-62. doi: 10.1111/acel.12100. Epub 2013 Jun 25. Aging Cell. 2013. PMID: 23692507 Free PMC article. - A guideline for analyzing circadian wheel-running behavior in rodents under different lighting conditions.
Jud C, Schmutz I, Hampp G, Oster H, Albrecht U. Jud C, et al. Biol Proced Online. 2005;7:101-16. doi: 10.1251/bpo109. Epub 2005 Jul 13. Biol Proced Online. 2005. PMID: 16136228 Free PMC article. - From clock to functional pacemaker.
Michel S, Meijer JH. Michel S, et al. Eur J Neurosci. 2020 Jan;51(1):482-493. doi: 10.1111/ejn.14388. Epub 2019 May 2. Eur J Neurosci. 2020. PMID: 30793396 Free PMC article. Review. - Aging of the circadian system in zebrafish and the effects of melatonin on sleep and cognitive performance.
Zhdanova IV, Yu L, Lopez-Patino M, Shang E, Kishi S, Guelin E. Zhdanova IV, et al. Brain Res Bull. 2008 Mar 18;75(2-4):433-41. doi: 10.1016/j.brainresbull.2007.10.053. Epub 2007 Nov 21. Brain Res Bull. 2008. PMID: 18331912 Free PMC article. - Opposing actions of Per1 and Cry2 in the regulation of Per1 target gene expression in the liver and kidney.
Richards J, All S, Skopis G, Cheng KY, Compton B, Srialluri N, Stow L, Jeffers LA, Gumz ML. Richards J, et al. Am J Physiol Regul Integr Comp Physiol. 2013 Oct 1;305(7):R735-47. doi: 10.1152/ajpregu.00195.2013. Epub 2013 Jul 3. Am J Physiol Regul Integr Comp Physiol. 2013. PMID: 23824961 Free PMC article.
References
- Albrecht U. 2002. Invited Review: Regulation of mammalian circadian clock genes. J. Appl. Physiol. 92: 1348–1355. - PubMed
- Albrecht U. and Foster, R.G. 2002. Placing ocular mutants into a functionalcontext: A chronobiological approach. Methods 28: 465–477. - PubMed
- Albrecht U. and Oster, H. 2001. The circadian clock and behavior. Behav. Brain Res. 125: 89–91. - PubMed
- Albrecht U., Sun, Z.S., Eichele, G., and Lee, C.C. 1997. A differential response of two putative mammalian circadian regulators, mper1 and mper2, to light. Cell 91: 1055–1064. - PubMed
- Albrecht U., Lu, H.-C., Revelli, J.-P., Xu, X.-C., Lotan, R., and Eichele, G. 1998. Studying gene expression on tissue sections using in situ hybridization. In Human genome methods (ed. K.W. Adolph), pp. 93–119. CRC Press, New York.
Publication types
MeSH terms
Substances
LinkOut - more resources
Full Text Sources
Medical
Molecular Biology Databases
