Genome sequence of an M3 strain of Streptococcus pyogenes reveals a large-scale genomic rearrangement in invasive strains and new insights into phage evolution - PubMed (original) (raw)
Comparative Study
. 2003 Jun;13(6A):1042-55.
doi: 10.1101/gr.1096703.
Ken Kurokawa, Atsushi Yamashita, Masanobu Nakata, Yusuke Tomiyasu, Nobuo Okahashi, Shigetada Kawabata, Kiyoshi Yamazaki, Tadayoshi Shiba, Teruo Yasunaga, Hideo Hayashi, Masahira Hattori, Shigeyuki Hamada
Affiliations
- PMID: 12799345
- PMCID: PMC403657
- DOI: 10.1101/gr.1096703
Comparative Study
Genome sequence of an M3 strain of Streptococcus pyogenes reveals a large-scale genomic rearrangement in invasive strains and new insights into phage evolution
Ichiro Nakagawa et al. Genome Res. 2003 Jun.
Abstract
Group Astreptococcus (GAS) is a gram-positive bacterial pathogen that causes various suppurative infections and nonsuppurative sequelae. Since the late 1980s, streptococcal toxic-shock like syndrome (STSS) and severe invasive GAS infections have been reported globally. Here we sequenced the genome of serotype M3 strain SSI-1, isolated from an STSS patient in Japan, and compared it with those of other GAS strains. The SSI-1 genome is composed of 1,884,275 bp, and 1.7 Mb of the sequence is highly conserved relative to strain SF370 (serotype M1) and MGAS8232 (serotype M18), and almost completely conserved relative to strain MGAS315 (serotype M3). However, a large genomic rearrangement has been shown to occur across the replication axis between the homologous rrn-comX1 regions and between two prophage-coding regions across the replication axis. Atotal of 1 Mb of chromosomal DNA is inverted across the replication axis. Interestingly, the recombinations between the prophage regions are within the phage genes, and the genes encoding superantigens and mitogenic factors are interchanged between two prophages. This genomic rearrangement occurs in 65% of clinical isolates (64/94) collected after 1990, whereas it is found in only 25% of clinical isolates (7/28) collected before 1985. These observations indicate that streptococcal phages represent important plasticity regions in the GAS chromosome where recombination between homologous phage genes can occur and result not only in new phage derivatives, but also in large chromosomal rearrangements.
Figures
Figure 1
Circular map of GAS strain SSI-1. The outer circle shows the scale (bp). Rings 1 and 2 show the coding sequence by strands (ring 1, clockwise; ring 2, counterclockwise). The predicted ORFs are distinguished by different colors in the COG classification. Ring 3: The genes for bacteriophage (pink), transposase genes and insertion sequence (black), adhesion molecules (green), hyaluronidase genes (blue), and other putative virulence factors (red). Ring 4: The GC skew analysis. Ring 5: The G+C contents. Rings 6 and 7: The ribosomal RNA (red) genes and transfer RNA (blue) genes identified in the genome. Red arrows: The origin of DNA replication (ori; Suvorov and Ferretti 2000) and the putative region of replication terminus (ter).
Figure 2
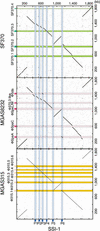
Comparison of the three sequenced GAS genomes based on the chromosomal organization of strain SSI-1. Dot-plot analyses were performed based on the genomic sequence of strain SSI-1 and the other three GAS strains (SF370, MGAS8232, and MGAS315). Deflection of segments along either axis indicates insertions of DNA segments. Segments not aligning along the diagonal line represent sequences that are similar but located in different parts of the genomes. Light blue, SSI-1-specific phages; pink, MGAS8232-specific phages; light green, SF370-specific phages; light orange, MGAS315-specific phages.
Figure 3
Comparison of genomic location of the homologous ORFs in GAS strains SSI-1 (M3) vs. SF370 (M1), SSI-1 vs. MGAS8232 (M18), and SSI-1 vs. MGAS315 (M3) (A), in GAS strains SF370 (M1) vs. MGAS8232 (M18) and SF370 vs. MGAS315 (M3) (B), in GAS strains and Streptococcus pneumoniae (C), or S. agalactiae 2603V/R (D). Pairs of homologous ORFs between two strains were generated by BLASTP analysis (E<1.0 × 10⁻⁵). The homologous ORFs on each chromosome are shown by connected green lines (the relative location of each ORF is conserved) or red lines (the relative location of each ORF is in the opposite direction). The blue line indicates the putative region of the replication terminus (ter).
Figure 4
Expanded views of the rrn-comX genomic rearrangement site between strain SSI-1 and other GAS strains. (A) Comparison of rrn-comX region in strain SSI-1 and strains SF370, MGAS315, or MGAS8232. HP, hypothetical protein. Red arrowheads indicate the rearrangement break-point in strain SSI-1, and green lines and arrows indicate the orientation of the rearrangement in strain SSI-1 compared with strain SF370. Gray dotted lines indicate orthologous genes that are located in relatively identical positions. (B) Long-PCR analysis of rrn-comX rearrangement site. Long-PCR was performed with PCR primers 1718F and 952R, and analyzed by agarose gel electrophoresis. (C) Expanded views of the phage rearrangement site between strain SSI-1 and other GAS strains. The gene order and sequences of the rearrangement sites of strain SSI-1 are compared with those of strains SF370, MGAS315, and MGAS8232 with MUMmer and CLUSTALW programs. Arrows represent the relative orientation of the genes. HP, hypothetical protein. Red arrowheads: The rearrangement break-point in strain SSI-1. Gray and pink dotted lines indicate the orthologous genes that are located in relatively identical positions or in the inverted chromosomal regions, respectively.
Figure 5
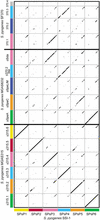
Dot-plot analysis of the six phages in strain SSI-1 with those in strain SF370 (M1), MGAS8232 (M18), and MGAS315 (M3). All phage sequences were extracted from each genome sequence and aligned with the integrase genes as the starting position. Homologous phage sequences are indicated in the same axis color. The width of each column corresponds to relative phage length.
Figure 6
Schematic diagram of phage-related rearrangements by chromosomal inversion. Two phages integrated equidistant from the ter region exchange their virulent cassettes. int, integrase gene of phage region. tox indicates superantigen, mitogenic factor, or streptodornase genes.
Similar articles
- Mosaic prophages with horizontally acquired genes account for the emergence and diversification of the globally disseminated M1T1 clone of Streptococcus pyogenes.
Aziz RK, Edwards RA, Taylor WW, Low DE, McGeer A, Kotb M. Aziz RK, et al. J Bacteriol. 2005 May;187(10):3311-8. doi: 10.1128/JB.187.10.3311-3318.2005. J Bacteriol. 2005. PMID: 15866915 Free PMC article. - Genome analysis of an inducible prophage and prophage remnants integrated in the Streptococcus pyogenes strain SF370.
Canchaya C, Desiere F, McShan WM, Ferretti JJ, Parkhill J, Brüssow H. Canchaya C, et al. Virology. 2002 Oct 25;302(2):245-58. doi: 10.1006/viro.2002.1570. Virology. 2002. PMID: 12441069 - Spontaneous recombination between homologous prophage regions causes large-scale inversions within the Escherichia coli O157:H7 chromosome.
Iguchi A, Iyoda S, Terajima J, Watanabe H, Osawa R. Iguchi A, et al. Gene. 2006 May 10;372:199-207. doi: 10.1016/j.gene.2006.01.005. Epub 2006 Mar 3. Gene. 2006. PMID: 16516407 - The fundamental contribution of phages to GAS evolution, genome diversification and strain emergence.
Banks DJ, Beres SB, Musser JM. Banks DJ, et al. Trends Microbiol. 2002 Nov;10(11):515-21. doi: 10.1016/s0966-842x(02)02461-7. Trends Microbiol. 2002. PMID: 12419616 Review. - Rise and persistence of global M1T1 clone of Streptococcus pyogenes.
Aziz RK, Kotb M. Aziz RK, et al. Emerg Infect Dis. 2008 Oct;14(10):1511-7. doi: 10.3201/eid1410.071660. Emerg Infect Dis. 2008. PMID: 18826812 Free PMC article. Review.
Cited by
- Experimental evolution under different nutritional conditions changes the genomic architecture and virulence of Acinetobacter baumannii.
Yun S, Min J, Han S, Sim HS, Kim SK, Lee JB, Yoon JW, Yeom J, Park W. Yun S, et al. Commun Biol. 2024 Oct 5;7(1):1274. doi: 10.1038/s42003-024-06978-w. Commun Biol. 2024. PMID: 39369115 Free PMC article. - Phage-mediated resolution of genetic conflict alters the evolutionary trajectory of Pseudomonas aeruginosa lysogens.
Suttenfield LC, Rapti Z, Chandrashekhar JH, Steinlein AC, Vera JC, Kim T, Whitaker RJ. Suttenfield LC, et al. mSystems. 2024 Sep 17;9(9):e0080124. doi: 10.1128/msystems.00801-24. Epub 2024 Aug 21. mSystems. 2024. PMID: 39166874 Free PMC article. - Gut phageome: challenges in research and impact on human microbiota.
Yu X, Cheng L, Yi X, Li B, Li X, Liu X, Liu Z, Kong X. Yu X, et al. Front Microbiol. 2024 Mar 22;15:1379382. doi: 10.3389/fmicb.2024.1379382. eCollection 2024. Front Microbiol. 2024. PMID: 38585689 Free PMC article. Review. - Comparative genomics analysis of Streptococcus iniae isolated from Trachinotus ovatus: novel insight into antimicrobial resistance and virulence differentiation.
Xiong X, Chen R, Lai J. Xiong X, et al. BMC Genomics. 2023 Dec 14;24(1):775. doi: 10.1186/s12864-023-09882-5. BMC Genomics. 2023. PMID: 38097934 Free PMC article. - A novel invasive Streptococcus pyogenes variant sublineage derived through recombinational replacement of the emm12 genomic region.
Unoarumhi Y, Davis ML, Rowe LA, Mathis S, Li Z, Chochua S, Li Y, McGee L, Metcalf BJ, Lee JS, Beall B. Unoarumhi Y, et al. Sci Rep. 2023 Dec 6;13(1):21510. doi: 10.1038/s41598-023-48035-2. Sci Rep. 2023. PMID: 38057343 Free PMC article.
References
- Alm, R.A., Ling, L.S., Moir, D.T., King, B.L., Brown, E.D., Doig, P.C., Smith, D.R., Noonan, B., Guild, B.C., deJonge, B.L., et al. 1999. Genomic-sequence comparison of two unrelated isolates of the human gastric pathogen Helicobacter pylori. Nature 397: 176–180. - PubMed
- Bentley, R.W., Leigh, J.A., and Collins, M.D. 1991. Intrageneric structure of Streptococcus based on comparative analysis of small-subunit rRNA sequences. Int. J. Syst. Bacteriol. 41: 487–494. - PubMed
- Beres, S.B., Sylva, G.L., Barbian, K.D., Lei, B., Hoff, J.S., Mammarella, N.D., Liu, M.Y., Smoot, J.C., Porcella, S.F., Parkins, L.D., et al. 2002. Genome sequence of a serotype M3 strain of group A Streptococcus: Phage-encoded toxins, the high-virulence phenotype, and clone emergence. Proc. Natl. Acad. Sci. 99: 10078–10083. - PMC - PubMed
WEB SITE REFERENCES
- http://www.ncbi.nlm.nih.gov/BLAST/; National Center for Biotechnology Information Web site for BLAST search.
- http://www.ncbi.nlm.nih.gov/COG/xognitor.html; Phylogenetic classification of proteins.
- http://www.megasoftware.net/; Phylogenetic tree analysis.
- http://sosui.proteome.bio.tuat.ac.jp/sosuiframe0.html; Prediction program of membrane proteins.
- http://psort.nibb.ac.jp; Prediction program of protein localizations.
Publication types
MeSH terms
Substances
LinkOut - more resources
Full Text Sources
Other Literature Sources
Molecular Biology Databases
Miscellaneous


