Transcription of mouse DNA methyltransferase 1 (Dnmt1) is regulated by both E2F-Rb-HDAC-dependent and -independent pathways - PubMed (original) (raw)
Transcription of mouse DNA methyltransferase 1 (Dnmt1) is regulated by both E2F-Rb-HDAC-dependent and -independent pathways
Hiromichi Kimura et al. Nucleic Acids Res. 2003.
Abstract
Abnormal expression of Dnmt1 in vivo induces cellular alterations such as transformation, and an increase in Dnmt1 mRNA plays a causal role in c-fos-, ras- and SV40 large T antigen-induced transformation of fibroblasts in vitro. Here, we have investigated the regulation of Dnmt1 transcription. We identified the promoter region and major transcription start sites of mouse Dnmt1 and found two important cis-elements within the core promoter region. One is an E2F binding site, and the other is a binding site for an as yet unidentified factor. Point mutations in the two cis-elements decreased promoter activity in both non-transformed and transformed cells. Thus, both sites play a critical role in regulation of Dnmt1 transcription in proliferating cells. Treatment with trichostatin A, a specific inhibitor of histone deacetylase, increased Dnmt1 promoter activity in G0/G1-arrested NIH 3T3 cells. Furthermore, the decrease in promoter activity induced by expression of E2F-1 and Rb was reversed by trichostatin A treatment of Saos-2 cells. Taken together, these data indicate that transcription of Dnmt1 is regulated in a complex fashion by E2F and other transcription factors through E2F-Rb-HDAC-dependent and -independent pathways. These findings suggest that Dnmt1 is a target gene of these pathways in cell proliferation, cell transformation and tumorigenesis.
Figures
Figure 1
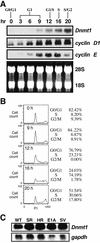
Expression of Dnmt1 mRNA during the cell cycle and in oncogenic transformed cells. (A) Northern blot showing expression of Dnmt1, cyclin D1 and cyclin E during the cell cycle. Quiescent NIH 3T3 cells were stimulated by replacement with complete medium including 10% fetal bovine serum and harvested at the indicated times. (B) Percentage of cells in each stage of the cell cycle at various times after serum stimulation. DNA amounts were measured by propidium iodide (PI) staining and FACScan analysis. The cell cycle distribution is indicated on the right of the histogram. (C) Northern blot showing expression of Dnmt1 in transformed 3Y1 cells, with gapdh as an internal control. WT, parental 3Y1 cells; SR, RSV-transformed 3Y1 cells; HR, Ha-ras transformed 3Y1 cells; E1A, E1A-transformed cells; SV, SV40-transformed 3Y1 cells.
Figure 2
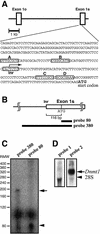
Identification of the transcription start sites of mouse Dnmt1. (A) Nucleotide sequence of the 5′-flanking region and the transcription start site of the mouse Dnmt1 showing the 299 bases upstream from the translation start codon. Boxes A–D indicate putative E2F binding sites. The transcription start site is indicated with an arrow. Exon 1o, oocyte-specific first exon; Exon 1s, somatic first exon; Inr, initiator consensus sequence (34,35). (B) Probes used in RNase protection assay. (C) RNase protection assay. RNA was prepared from NIH 3T3 cells. The major 190 base fragment protected by probe 380 is indicated with an arrow. RMW, size standards with sizes (base pair) corrected for the slower migration of double-stranded RNA based on the migration of the 80 bp double-stranded RNA protected by probe 80 (arrowhead). (D) Northern blot analysis confirmed the transcription of the 5′ region of mouse Dnmt1. Total RNA from NIH 3T3 cells was hybridized to probe 1, located 610 bases upstream from the initiator sequence, or probe 2, which corresponds to the Dnmt1 catalytic domain (33).
Figure 3
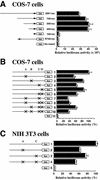
Identification of the core promoter region of mouse Dnmt1 and two critical binding sites. (A) COS-7 cells were transfected with several promoter fragments linked to a luciferase reporter construct. Results are shown as relative luciferase activity after 48 h. Bars indicate standard deviations (SD). COS-7 cells were transfected with serial deletion constructs of the upstream region: 2061-luc, 736-luc, 500-luc, 300-luc, 100-luc, R736-luc (the 736 bp upstream region in reverse orientation) and No insert-luc (PGV-B2) constructs. (B) COS-7 cells were transiently transfected with constructs containing the first 300 bases upstream of the start codon either with wild-type or mutated (crosses) putative E2F binding sites, or with No insert-luc (PGV-B2). Luciferase activity of the wild-type 300-luc (column 1) was defined to be 100%. (C) As in (B), except that NIH 3T3 cells were used instead of COS-7 cells.
Figure 4
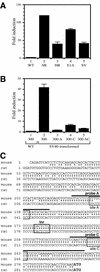
Promoter activity of the core promoter region of mouse Dnmt1 in transformed 3Y1 cells. (A) Several cell lines were transiently transfected with the 300-luc construct and luciferase activity was measured as in Figure 3. WT, parental 3Y1 cells; SR, RSV-transformed 3Y1 cells; HR, Ha-ras transformed 3Y1 cells; E1A, E1A-transformed cells; SV, SV40-transformed 3Y1 cells. (B) SV-3Y1 cells were transfected with the 300-luc construct, a construct with mutated site A (300 A), a construct with mutated site C (300 C) or a construct in which both sites A and C were mutated (300 AC). Numbers shown are fold induction relative to luciferase activity of 300-luc. (C) Comparison of the core promoter region of Dnmt1 between mouse and rat. Inr, initiator sequence: sites A and C correspond to those shown in Figure 2A.
Figure 5
EMSAs to identify molecules bound to site A and site C in the core promoter region of mouse Dnmt1. (A) Complex formation of 10 µg of whole cell extracts (WCE) from NIH 3T3 cells and 32P-labeled site A oligonucleotides (probe A) analyzed under E2F gel shift conditions. Excess unlabeled oligonucleotides (1:150 molar) were used as competitors; A, site A oligonucleotide; E2F, E2F binding site consensus oligonucleotide; C, site C oligonucleotide; mA, mutated site A oligonucleotide. An arrow indicates the probe A–protein complex. (B) Complex formation as above analyzed under alternative gel shift conditions (see Materials and Methods) with 8 µg of WCE. Excess unlabeled oligonucleotides (1:75 molar) were used as competitors; Sp, Sp-1 consensus oligonucleotide; others as in (A). An arrow indicates the probe A–protein complex. (C) Different patterns of mobility shift in sites A and C. The assays were carried out as in (A). An arrow indicates the probe A–protein complex. (D) Complex formation on 32P-labeled site C oligonucleotides. Conditions and competitors are the same as in (A). The upper bracket indicates probe C–protein complexes, representative of E2F bound to site C.
Figure 6
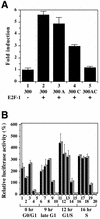
Promoter activity of two _cis_-elements enhanced by E2F-1 during the cell cycle. (A) Effect of E2F-1 on the activity of the Dnmt1 core promoter region in NIH 3T3 cells co-transfected with the E2F-1 expression vector pDCE2F-1 and the Dnmt1 promoter constructs. NIH 3T3 cells were co-transfected with either the 300-luc construct (300), the construct with mutated site A (300 A), the construct with mutated site C (300 C) or a construct with mutated sites A and C (300 AC). The ratio of luciferase reporter plasmid, E2F-1 expression vector and pRL-SV internal control vector is 10:10:1. Luciferase activity was determined as described in Figure 3A. Numbers shown are fold induction relative to luciferase activity of 300-luc in wild-type, parental 3Y1 cells. (B) Activity of intact and mutated Dnmt1 promoters at various stages in the cell cycle. NIH 3T3 cells were transfected with the 300-luc (columns 1, 6, 11 and 16), 300 A-luc (columns 2, 7, 12 and 17), 300 C-luc (columns 3, 8, 13 and 18), 300 AC-luc (columns 4, 9, 14 and 19) and No insert-luc (columns 5, 10, 15 and 20). After 24 h, the cells were arrested by serum starvation, and 36 h later were stimulated by replacement with complete medium. The cells were harvested at the indicated times after serum stimulation for luciferase activity analysis. The luciferase activities are normalized to Renilla luciferase activity. Numbers indicated are luciferase activity relative to the No insert-luc at each time point.
Figure 7
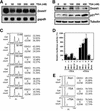
HDAC-dependent repression of Dnmt1 transcription. (A) Northern blot showing expression of Dnmt1 mRNA in NIH 3T3 cells 24 h after addition of TSA at the indicated concentrations. Ten micrograms of total RNA were analyzed. (B) Western blot analysis reveals protein levels in NIH 3T3 cells treated with TSA. Twenty micrograms of WCE were subjected to western blot analysis with the indicated antibodies. (C) Cell cycle distribution of NIH 3T3 cells 24 h after addition of TSA at indicated concentrations. DNA content was measured by flow cytometry. (D) Effect of TSA on the activity of the Dnmt1 core promoter region at G0/G1 phase. NIH 3T3 cells were transfected with 300-luc (columns 1 and 6), 300 A-luc (columns 2 and 7), 300 C-luc (columns 3 and 8), 300 AC-luc (columns 4 and 9) or No insert-luc (columns 5 and 10). Twenty-four hours later, cells were growth-arrested by serum starvation for 36 h. Cells were subsequently treated with or without TSA (200 nM) for 24 h before luciferase activity was determined. Luciferase activity is normalized to Renilla luciferase activity and is shown relative to No insert-luc transfections (columns 5 and 10). (E) Effect of TSA on growth-arrested cells. Prior to flow cytometry, NIH 3T3 cells were serum starved for 36 h, and then treated with (+TSA) or without (–TSA) 200 nM TSA for 24 h. Asyn, asynchronized NIH 3T3 cells.
Figure 8
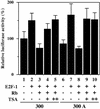
The E2F-Rb-HDAC complex decreases the promoter activity of mouse Dnmt1. Saos-2 cells were co-transfected with the plasmids indicated in the figure. The ratio of luciferase reporter plasmid, E2F-1 expression vector, Rb expression vector and pRL-SV40 internal control vector was 10:10:60:1. TSA was added 24 h after transfection. TSA (+) and TSA (++) indicate treatment with concentrations of 100 and 200 nM, respectively. Luciferase activity was determined 48 h post-transfection. The luciferase counts were normalized to Renilla luciferase activity. The standard luciferase activity (100%) was defined as that of cells transfected with the 300-luc and empty expression vectors (column 1).
Figure 9
A proposed model for the regulatory mechanisms of mouse Dnmt1 transcription. At all stages of the cell cycle, there is basal level expression of Dnmt1 driven by site A. The E2F site alters transcription by different means, depending on the phase of the cell cycle. At G0/G1 phase Rb can bind to E2F, recruiting HDAC to the complex, resulting in repression of transcription of Dnmt1. A transcription factor bound to site A (TFBA) maintains low transcriptional levels of Dnmt1. At G1/S phase, the inhibition of Dnmt1 transcription mediated by the E2F site is released, and E2F and TFBA now work cooperatively to increase the expression levels in a regulated manner.
Similar articles
- DNMT1 forms a complex with Rb, E2F1 and HDAC1 and represses transcription from E2F-responsive promoters.
Robertson KD, Ait-Si-Ali S, Yokochi T, Wade PA, Jones PL, Wolffe AP. Robertson KD, et al. Nat Genet. 2000 Jul;25(3):338-42. doi: 10.1038/77124. Nat Genet. 2000. PMID: 10888886 - Retinoblastoma protein recruits histone deacetylase to repress transcription.
Brehm A, Miska EA, McCance DJ, Reid JL, Bannister AJ, Kouzarides T. Brehm A, et al. Nature. 1998 Feb 5;391(6667):597-601. doi: 10.1038/35404. Nature. 1998. PMID: 9468139 - Regulation of DNA methyltransferase 1 by the pRb/E2F1 pathway.
McCabe MT, Davis JN, Day ML. McCabe MT, et al. Cancer Res. 2005 May 1;65(9):3624-32. doi: 10.1158/0008-5472.CAN-04-2158. Cancer Res. 2005. PMID: 15867357 - The Rb/chromatin connection and epigenetic control: opinion.
Ferreira R, Naguibneva I, Pritchard LL, Ait-Si-Ali S, Harel-Bellan A. Ferreira R, et al. Oncogene. 2001 May 28;20(24):3128-33. doi: 10.1038/sj.onc.1204337. Oncogene. 2001. PMID: 11420729 Review. - A revised picture of the E2F transcriptional network and RB function.
Stevaux O, Dyson NJ. Stevaux O, et al. Curr Opin Cell Biol. 2002 Dec;14(6):684-91. doi: 10.1016/s0955-0674(02)00388-5. Curr Opin Cell Biol. 2002. PMID: 12473340 Review.
Cited by
- Flow cytometry of DNMT1 as a biomarker of hypomethylating therapies.
Woost PG, William BM, Cooper BW, Ueda Oshima M, Otegbeye F, De Lima MJ, Wald D, Mahfouz RZ, Saunthararajah Y, Stefan T, Jacobberger JW. Woost PG, et al. Cytometry B Clin Cytom. 2024 Jan;106(1):11-24. doi: 10.1002/cyto.b.22158. Epub 2024 Feb 12. Cytometry B Clin Cytom. 2024. PMID: 38345160 - DNA hypomethylation activates Cdk4/6 and Atr to induce DNA replication and cell cycle arrest to constrain liver outgrowth in zebrafish.
Madakashira BP, Magnani E, Ranjan S, Sadler KC. Madakashira BP, et al. Nucleic Acids Res. 2024 Apr 12;52(6):3069-3087. doi: 10.1093/nar/gkae031. Nucleic Acids Res. 2024. PMID: 38321933 Free PMC article. - Potent Stimulation of the Androgen Receptor Instigates a Viral Mimicry Response in Prostate Cancer.
Alizadeh-Ghodsi M, Owen KL, Townley SL, Zanker D, Rollin SPG, Hanson AR, Shrestha R, Toubia J, Gargett T, Chernukhin I, Luu J, Cowley KJ, Clark A, Carroll JS, Simpson KJ, Winter JM, Lawrence MG, Butler LM, Risbridger GP, Thierry B, Taylor RA, Hickey TE, Parker BS, Tilley WD, Selth LA. Alizadeh-Ghodsi M, et al. Cancer Res Commun. 2022 Jul 25;2(7):706-724. doi: 10.1158/2767-9764.CRC-21-0139. eCollection 2022 Jul. Cancer Res Commun. 2022. PMID: 36923279 Free PMC article. - miR-539-5p regulates Srebf1 transcription in the skeletal muscle of diabetic mice by targeting DNA methyltransferase 3b.
Kesharwani D, Kumar A, Rizvi A, Datta M. Kesharwani D, et al. Mol Ther Nucleic Acids. 2022 Aug 13;29:718-732. doi: 10.1016/j.omtn.2022.08.013. eCollection 2022 Sep 13. Mol Ther Nucleic Acids. 2022. PMID: 36090753 Free PMC article. - Epigenetic modulation in sensitizing metastatic sarcomas to therapies and overcoming resistance.
Rytlewski J, Brockman QR, Dodd RD, Milhem M, Monga V. Rytlewski J, et al. Cancer Drug Resist. 2022 Jan 4;5(1):25-35. doi: 10.20517/cdr.2021.88. eCollection 2022. Cancer Drug Resist. 2022. PMID: 35582536 Free PMC article.
References
- Razin A. and Szyf,M. (1984) DNA methylation patterns. Formation and function. Biochim. Biophys. Acta, 782, 331–342. - PubMed
- Ohgane J., Wakayama,T., Kogo,Y., Senda,S., Hattori,N., Tanaka,S., Yanagimachi,R. and Shiota,K. (2001) DNA methylation variation in cloned mice. Genesis, 30, 45–50. - PubMed
- Cho J.H., Kimura,H., Minami,T., Ohgane,J., Hattori,N., Tanaka,S. and Shiota,K. (2001) DNA methylation regulates placental lactogen I gene expression. Endocrinology, 142, 3389–3396. - PubMed
- Shiota K., Kogo,Y., Ohgane,J., Imamura,T., Urano,A., Nishino,K., Tanaka,S. and Hattori,N. (2002) Epigenetic marks by DNA methylation specific to stem, germ and somatic cells in mice. Genes Cells, 7, 961–969. - PubMed
- Bird A.P. and Wolffe,A.P. (1999) Methylation-induced repression—belts, braces and chromatin. Cell, 99, 451–454. - PubMed
Publication types
MeSH terms
Substances
LinkOut - more resources
Full Text Sources
Other Literature Sources
Molecular Biology Databases
