VEGF guides angiogenic sprouting utilizing endothelial tip cell filopodia - PubMed (original) (raw)
VEGF guides angiogenic sprouting utilizing endothelial tip cell filopodia
Holger Gerhardt et al. J Cell Biol. 2003.
Abstract
Vascular endothelial growth factor (VEGF-A) is a major regulator of blood vessel formation and function. It controls several processes in endothelial cells, such as proliferation, survival, and migration, but it is not known how these are coordinately regulated to result in more complex morphogenetic events, such as tubular sprouting, fusion, and network formation. We show here that VEGF-A controls angiogenic sprouting in the early postnatal retina by guiding filopodial extension from specialized endothelial cells situated at the tips of the vascular sprouts. The tip cells respond to VEGF-A only by guided migration; the proliferative response to VEGF-A occurs in the sprout stalks. These two cellular responses are both mediated by agonistic activity of VEGF-A on VEGF receptor 2. Whereas tip cell migration depends on a gradient of VEGF-A, proliferation is regulated by its concentration. Thus, vessel patterning during retinal angiogenesis depends on the balance between two different qualities of the extracellular VEGF-A distribution, which regulate distinct cellular responses in defined populations of endothelial cells.
Figures
Figure 1.
Schematic presentation of retina development as a model system for investigation of angiogenic sprouting in the CNS. Corresponding top view micrographs of whole mount isolectin- labeled specimen are shown to the right. The top view displays the primary plexus in the fiber layer of the retina. Sprouting occurs toward the periphery in the primary plexus (P1 and P5, arrows) and subsequently into deeper layers (P8, arrows), where again branching and fusion leads to plexus formation.
Figure 2.
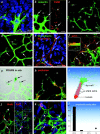
Characterization of the endothelial tip cell. Isolectin staining is shown in green and nuclei staining is shown in blue. e, endothelium; m, macrophages/microglia. (a) High magnification confocal micrograph showing typical filopodia extension at the leading edge of the primary retinal plexus. Note the single endothelial nucleus. (b) Double labeling for isolectin and macrophage marker F4/80 distinguishes between endothelium (e, only green) and macrophages (m, green and red). Arrows point to sprouting tips. (c) Filopodia at sprouting tips in the deeper retinal plexus, and (d) at remodeling sites (arrows) in the primary plexus. (e) High magnification of a sprouting tip triple labeled for VE-cadherin (cell borders and junctions), fibronectin (astrocytes and vessel basement membrane), and nuclei. Note focal filopodia extension at the tip (arrow), whereas following cells extend no filopodia (arrowheads). (f) Filopodia are highly enriched in actin filaments (red and green, arrows and blow up inset), whereas endothelial cells without filopodia show little actin (green, arrowheads). (g) PDGFB in situ hybridization reveals tip cell–specific gene expression (arrows). (h) Dextran perfusion (false colored in red) revealing endothelial lumina. Note lumen-free tip cell to the left. (i) Graphic illustration of tip cell and stalk cell terminology. (j) Overview micrograph visualizing endothelial proliferation in the plexus (arrows) but not in the tip region (box, magnified in k). Note lack of Ki67 labeling or Brdu labeling in tip cells (stars), whereas stalk cells and plexus cells near the tip label weakly (arrows). (l) Distribution of proliferating endothelial cells given as percent of the total. 10 retinas labeled for Ki67 were analyzed. Note lack of tip cell proliferation (star). Bars, 20 μm.
Figure 3.
Tip cell migration and stalk cell proliferation in the aortic ring sprouting model. (a) Selected sequence from a time-lapse movie focusing on a single sprout prelabeled for PECAM-1 (red). Note lamellipodia protrusions and continued migration of the leading cell (arrows). (b) Representative image of a single sprout labeled for PECAM-1 (red) and mitosis (phospho-histone, green) and nuclei (Blue). Note that proliferation is confined to the stalk; tip cells do not proliferate (see star and panel c). Total sprout length from the ring margin to the tip of each sprout was measured in a single ring quadrant from each of the three time points (days 5, 7, and 9). The distance from the ring to mitotic endothelial cells along these same sprouts was also measured. The histograms represent the mean of the total length of PECAM-positive sprouts over the 3 d versus the mean length distance to endothelial cell mitosis.
Figure 4.
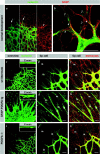
Astrocytes guide endothelial tip cell filopodia. (a) Over view micrograph, displaying overlap of vascular and astrocytic network. Note that the leading edge of the vascular plexus (arrows) is clearly visible in the astrocytic pattern (arrowhead). (b) High magnification illustrating alignment of tip cell filopodia with astrocytic processes (filled arrowheads). Note undulating appearance of filopodia that lack astrocytic contact (open arrowheads). (c–k) Illustration of the dominant effect of astrocytes on the retinal vascular plexus. Vessel density is regulated by astrocyte density (c). Wild-type overview displaying a single layer of vessels in alignment with the astrocytic network (d and e). (f) Supernumerous astrocytes in GFAP-PDGFA transgenics lead to multilayered blood vessels (see also z scan inset). Tip cells truthfully follow the aberrantly dense astrocytic cords (g and h). (i–k) PDGFA deficiency leads to a sparse vascular network as a result of a sparse astrocytic network. m, macrophages; e, endothelial cells. Bars, 20 μm.
Figure 5.
Illustration of tip cell guidance toward VEGF sources and of VEGFR expression on endothelial filopodia. (a–c) Confocal laser scanning micrographs of VEGF-A in situ hybridization (black signal) combined with double labeling for isolectin and GFAP. (a) Overview illustrating strong VEGF-A expression ahead of the vascular plexus and very low behind the leading edge. (b) Higher magnification showing astrocytic VEGF-A expression (black and red overlap) and strong down-regulation in astrocytes covered by the primary plexus. (c) Tip cell filopodia orientate toward and along VEGF-A–expressing astrocytes. (d) VEGFR2 in situ hybridization identifies strongest expression in the tip cells (arrows). (e and f) VEGFR2 is prominent on tip cell filopodia (arrowheads). (e) Rat mAb labeling using tyramide enhancer kit on cryosection, and (f) goat polyclonal antibody on whole mount labeling together with isolectin.
Figure 6.
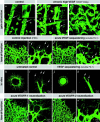
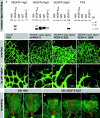
Illustration of filopodia induction in hyaloid vessels of VEGF164tg. (a) Wild-type littermate showing normal smooth surface of the hyaloid vessels (arrows) lying on the inner surface of the retina. Filopodia are only present in the intraretinal vascular plexus (asterisks). (b and c) Hyaloid vessels in VEGF164tg are studded with filopodia (arrows and inset). Bundles of filopodia are involved in sprouting and fusion (arrowhead), leading to an aberrant hyperfused vascular structure. Bars, 20 μm. VEGF is necessary for filopodia extension: (d–g) acute sequestering of VEGF by intraocular injection of soluble Flt-1–IgG chimeric protein leads to filopodia retraction already after 6 h (earliest time point investigated). (h–k) VEGF sequestering inhibits tip cell filopodia in the aortic ring assay. (l–o) Acute neutralization of VEGFR2 (n and o) but not VEGFR1 (l and m) leads to retraction of tip cell filopodia.
Figure 7.
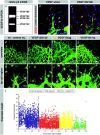
VEGF gradients shaped by heparin-binding isoforms are necessary for directed tip cell filopodia extension. (a) RT-PCR analysis detects four VEGF isoforms in the retina at P5. The predominant form is VEGF 164 that binds to heparan sulfate proteoglycan. (b) VEGF protein is located in the vicinity of astrocytes in wild-type retinas (a). (c) VEGF 120 protein distributes further away from the astrocytes and can be found around ganglion cells (arrows). (d–l) Flattening of the VEGF gradient leads to filopodia shortening, misorientation (see also Fig. 8) and reduced migration (see also Fig. 9, j and k). (d and h) Control injection overview and tip cell filopodia detail. (e and i) VEGF120/120 retinas display reduced filopodia length and sprouting but increased vessel diameter. Filopodia also extend in aberrant directions (see also Fig. 9). (f and j) VEGF120 transgenes expressing VEGF120 from the lens-specific crystallin promoter. Note massive enlargement of vessel diameter and chaotic sprouting and fusion but little sprouting toward the periphery. Filopodia length is also reduced (not quantified). (g and k) Intraocular injection of VEGF leads to a similar situation as seen in the VEGF120/120 mice. Reduced sprouting and filopodia length but ongoing proliferation (data not depicted) leads to enlarged vessel diameter. Note that in all situations the flattening of VEGF gradients leads to inhibition of filopodia extension and migration. Additional misorientation is documented in Fig. 9. (l) Quantification of filopodia length in the control situation, two situations of flattened VEGF gradient, however with difference in overall concentration, and one situation with acute VEGF sequestering. Each dot represents one filopodium. Data are collected from at least five different retinas for each group.
Figure 8.
Disturbance of VEGF gradients leads to misguidance of tip cell filopodia. Representative illustrations of the tip cell in wild-type (a), VEGF120/120 (b), and VEGF120tg (c) retinas. Left hand panels (a1–c1) show confocal images focused around the ILM, middle panels (a2–c2) show extended depth of focus ranging from the ILM to the fiber layer, and right hand panels (a3–c3) show schematic z sections. Black bars on the right indicate the level and depth of focus in panels a1–c1 and a2–c2. (a) Wild-type vessels extend filopodia strictly in the plane of the astrocytes, thus giving only a faint shadow in the level of the ILM (a1, arrow). Extended depth of focus reveals smooth surface of the stalk cells (a2, arrowheads). Orientation and steepness of wild-type VEGF gradient is indicated by a white arrowhead in a3. (b) VEGF120/120 tip cells show a characteristic loss of polarization leading to ectopic filopodia (blow up in inset) that leave the astrocytic plane (b1, arrows) and protrude also from the stalk cells (b2, arrowheads). This is likely to be caused by a flattened VEGF gradient (b3, arrowhead). (c) VEGF120tg tip cells display the most drastic loss of polarization once they leave the retinal tissue proper (c1). Note the sprout is extending in the plane of the ILM. Filopodia contacting the ILM possess characteristic swellings at the ends (inset). Sprouts within the retina also display loss of polarization characterized by ectopic filopodia (c1 and c2, arrowheads). Vertical arrowhead in c3 indicates ectopic VEGF 120 expression from the lens. Bar, 20 μm.
Figure 9.
Receptor specificity. (a) Binding of VEGF-E to VEGFR–IgG fusion proteins. VEGFR–IgG fusion proteins were incubated with purified histidine-tagged growth factors and precipitated with protein A sepharose. After reducing SDS-PAGE and Western blotting, receptor-bound growth factors were detected with pentahistidine antibodies. Both forms of VEGF-E (NZ2 and NZ7) show significant interaction only with VEGFR-2, whereas VEGF-A interacts additionally with VEGFR-1 and VEGF-C additionally with VEGFR-3. (b–i) Intraocular injection of VEGFR–specific ligands at 1 μg/μl concentrations. Retinas were fixed after 24 h. (b) Human serum albumin injection has no effect on patterning or filopodia (f). (c) VEGFR1-specific ligand leads to macrophage recruitment (round cells) but has no effect on patterning or tip cell filopodia (g). (d) VEGFR2-specific ligand mimics VEGF-A injection and VEGF120/120 retinas (compare with Fig. 7, e and g). Note the lack of sprouting but increased vessel diameter and density. Only few very short filopodia are present (h, arrow). (e) VEGFR-3–specific ligand VEGF-C156S had no effect on patterning or tip cell filopodia (i). (j and k) Spreading of the vascular plexus over the retina is a measure of migration. Under all conditions of disturbed VEGF gradients, the spreading of the vasculature toward the periphery is significantly reduced. Examples are shown for VEGF-E injection. Overview pictures were taken on P6. Spreading distance as measured from the optic disc is indicated by red doubled arrow.
Similar articles
- Neuropilin-1 is required for endothelial tip cell guidance in the developing central nervous system.
Gerhardt H, Ruhrberg C, Abramsson A, Fujisawa H, Shima D, Betsholtz C. Gerhardt H, et al. Dev Dyn. 2004 Nov;231(3):503-9. doi: 10.1002/dvdy.20148. Dev Dyn. 2004. PMID: 15376331 - How do endothelial cells orientate?
Gerhardt H, Betsholtz C. Gerhardt H, et al. EXS. 2005;(94):3-15. doi: 10.1007/3-7643-7311-3_1. EXS. 2005. PMID: 15617467 Review. - Angiogenic and astroglial responses to vascular endothelial growth factor administration in adult rat brain.
Krum JM, Mani N, Rosenstein JM. Krum JM, et al. Neuroscience. 2002;110(4):589-604. doi: 10.1016/s0306-4522(01)00615-7. Neuroscience. 2002. PMID: 11934468 - PEDF derived from glial Müller cells: a possible regulator of retinal angiogenesis.
Eichler W, Yafai Y, Keller T, Wiedemann P, Reichenbach A. Eichler W, et al. Exp Cell Res. 2004 Sep 10;299(1):68-78. doi: 10.1016/j.yexcr.2004.05.020. Exp Cell Res. 2004. PMID: 15302574 - Role of the vascular endothelial growth factor isoforms in retinal angiogenesis and DiGeorge syndrome.
Stalmans I. Stalmans I. Verh K Acad Geneeskd Belg. 2005;67(4):229-76. Verh K Acad Geneeskd Belg. 2005. PMID: 16334858 Review.
Cited by
- Neurovascular crosstalk coordinates the central nervous system development.
Peguera B, Segarra M, Acker-Palmer A. Peguera B, et al. Curr Opin Neurobiol. 2021 Aug;69:202-213. doi: 10.1016/j.conb.2021.04.005. Epub 2021 May 30. Curr Opin Neurobiol. 2021. PMID: 34077852 Free PMC article. Review. - Endothelial cell invasion is controlled by dactylopodia.
Figueiredo AM, Barbacena P, Russo A, Vaccaro S, Ramalho D, Pena A, Lima AP, Ferreira RR, Fidalgo MA, El-Marjou F, Carvalho Y, Vasconcelos FF, Lennon-Duménil AM, Vignjevic DM, Franco CA. Figueiredo AM, et al. Proc Natl Acad Sci U S A. 2021 May 4;118(18):e2023829118. doi: 10.1073/pnas.2023829118. Proc Natl Acad Sci U S A. 2021. PMID: 33903241 Free PMC article. - Tubeless microfluidic angiogenesis assay with three-dimensional endothelial-lined microvessels.
Bischel LL, Young EW, Mader BR, Beebe DJ. Bischel LL, et al. Biomaterials. 2013 Feb;34(5):1471-7. doi: 10.1016/j.biomaterials.2012.11.005. Epub 2012 Nov 26. Biomaterials. 2013. PMID: 23191982 Free PMC article. - Short term interactions with long term consequences: modulation of chimeric vessels by neural progenitors.
Williams C, Rauch MF, Michaud M, Robinson R, Xu H, Madri J, Lavik E. Williams C, et al. PLoS One. 2012;7(12):e53208. doi: 10.1371/journal.pone.0053208. Epub 2012 Dec 27. PLoS One. 2012. PMID: 23300890 Free PMC article. - Cellular connections, microenvironment and brain angiogenesis in diabetes: Lost communication signals in the post-stroke period.
Ergul A, Valenzuela JP, Fouda AY, Fagan SC. Ergul A, et al. Brain Res. 2015 Oct 14;1623:81-96. doi: 10.1016/j.brainres.2015.02.045. Epub 2015 Mar 3. Brain Res. 2015. PMID: 25749094 Free PMC article. Review.
References
- Ausprunk, D.H., and J. Folkman. 1977. Migration and proliferation of endothelial cells in preformed and newly formed blood vessels during tumor angiogenesis. Microvasc. Res. 14:53–65. - PubMed
- Bär, T., and J.R. Wolff. 1972. The formation of capillary basement membranes during internal vascularization of the rat's cerebral cortex. Z Zellforsch Mikrosk. Anat. 133:231–248. - PubMed
- Bonanno, E., M. Iurlaro, J.A. Madri, and R.F. Nicosia. 2000. Type IV collagen modulates angiogenesis and neovessel survival in the rat aorta model. In Vitro Cell. Dev. Biol. Anim. 36:336–340. - PubMed
Publication types
MeSH terms
Substances
LinkOut - more resources
Full Text Sources
Other Literature Sources
Molecular Biology Databases

