Determining the basis of channel-tetramerization specificity by x-ray crystallography and a sequence-comparison algorithm: Family Values (FamVal) - PubMed (original) (raw)
Determining the basis of channel-tetramerization specificity by x-ray crystallography and a sequence-comparison algorithm: Family Values (FamVal)
Max H Nanao et al. Proc Natl Acad Sci U S A. 2003.
Abstract
We have developed a semiempirical algorithm called Family Values (FamVal), which identifies residues that encode functional specificity in a protein sequence. Given a multiple sequence alignment (MSA) grouped into functionally distinct subfamilies, FamVal calculates a specificity score for each subfamily at every amino acid position of an MSA. This algorithm was used to predict specificity-encoding positions within the tetramerization assembly (T1) domain of voltage-gated potassium (Kv) channel subfamilies Kv3 and Kv4. The importance of one such position (Arg to Ala at MSA position 93) was confirmed by in vitro pull-down assays. The structural basis of this assembly discrimination was elucidated by determining the crystal structure of the Kv4 T1 domain and comparing it to the Kv3 T1 domain.
Figures
Fig. 1.
Schematic representation of chemical-property vectors. Vectors are constructed for each MSA position independently for a given subfamily and again for the entire family. Here, an example MSA containing six sequences from two subfamilies is plotted in two dimensions (hydrophobicity on the_y_ and polarity on the x axis). Red and blue vectors represent subfamily vectors for subfamilies A and B, respectively. In the leftmost plot, they represent the sums of three Ds for subfamily A, or three Es for subfamily B. A purple vector represents the overall vector at the MSA position. The subfamily's FamVal scores are computed by comparing the distances (green dotted lines) between the subfamily-vector endpoints and the overall-vector endpoints, weighted by multiplying by sin (θ/2). A table containing normalized chemical-property scales used for FamVal scores in this study is shown at the bottom.
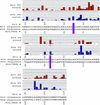
Fig. 2.
Actual FamVal scores of Kv4 and Kv3 T1 domains. Red and blue bars represent FamVal scores for Kv3 and Kv4 subfamilies, in units of σ above the mean. Each horizontal line represents 1 σ. Actual amino acid residues are shown below. Those positions highlighted in purple bars (MSA positions 66 and 93) are the only positions that scored above 2σ for both Kv4 and Kv3. The raw sequence alignment can be found at
http://sbl.salk.edu/\~mnanao/kvalign.txt
.
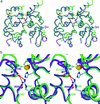
Fig. 3.
Superposition of Kv3 (purple) and Kv4 T1 (green) structures. Only two neighboring subunits of four subunits are shown for clarity. The four-fold symmetry axis is vertical in this view. (a) Two positions (Arg-93 and Ala-63, or Leu-66 and Arg-35) that scored above 2σ for both Kv4 and Kv3, respectively, are labeled with their side chains. Interacting amino acids for Arg-93 are also shown only for Kv4: Asp-88 and Glu-110. Zinc atoms known to be essential for the assembly interface are shown as spheres: Kv3 (red) and Kv4 (yellow). Side chains of three cysteines and one histidine coordinating the zinc are shown only for Kv4 T1. Note that the coordination of zinc is identical by the same set of amino acids: three Cys and one His. (b) Atomic interactions in the region of the MSA position 93 (Arg-93 of Kv4 or Ala-63 of Kv3) are shown. Residue numbers are given for their true amino acid positions. They are Asp-88 and Glu-110 of Kv4 backbone (green) and His-58 and Val-80 of Kv3 backbone (purple).
Fig. 4.
In vitro pull-down assay of purified Kv3 and Kv4 T1 mutants. Below the gels, bait proteins Kv3(WT), Kv3(A63R), and Kv4(WTL) that are tagged by N-terminal 6-histidine tags are shown (Upper). Molecular weights of these bands range from ≈12 to ≈15 kDa. To test self-association of Kv4, a Kv4 WT with a 16-aa C-terminal extension [Kv4(WTL)] was used. The difference in size allowed us to distinguish them by SDS/PAGE. (Lower) The test proteins [Kv4(WT) and Kv4(R93A)] that are not histidine-tagged. Black bars represent the presence of those bait and test proteins in the reaction mixtures. The presence of the corresponding bands in the gels indicates the assembly affinity between them.
Similar articles
- Structural insights into the functional interaction of KChIP1 with Shal-type K(+) channels.
Zhou W, Qian Y, Kunjilwar K, Pfaffinger PJ, Choe S. Zhou W, et al. Neuron. 2004 Feb 19;41(4):573-86. doi: 10.1016/s0896-6273(04)00045-5. Neuron. 2004. PMID: 14980206 - The role of Zn2+ in Shal voltage-gated potassium channel formation.
Strang C, Kunjilwar K, DeRubeis D, Peterson D, Pfaffinger PJ. Strang C, et al. J Biol Chem. 2003 Aug 15;278(33):31361-71. doi: 10.1074/jbc.M304268200. Epub 2003 May 15. J Biol Chem. 2003. PMID: 12754210 - Two N-terminal domains of Kv4 K(+) channels regulate binding to and modulation by KChIP1.
Scannevin RH, Wang K, Jow F, Megules J, Kopsco DC, Edris W, Carroll KC, Lü Q, Xu W, Xu Z, Katz AH, Olland S, Lin L, Taylor M, Stahl M, Malakian K, Somers W, Mosyak L, Bowlby MR, Chanda P, Rhodes KJ. Scannevin RH, et al. Neuron. 2004 Feb 19;41(4):587-98. doi: 10.1016/s0896-6273(04)00049-2. Neuron. 2004. PMID: 14980207 - Excitability is mediated by the T1 domain of the voltage-gated potassium channel.
Choe S, Cushman S, Baker KA, Pfaffinger P. Choe S, et al. Novartis Found Symp. 2002;245:169-75; discussion 175-7, 261-4. Novartis Found Symp. 2002. PMID: 12027006 Review. - Structural organization of the voltage sensor in voltage-dependent potassium channels.
Papazian DM, Silverman WR, Lin MC, Tiwari-Woodruff SK, Tang CY. Papazian DM, et al. Novartis Found Symp. 2002;245:178-90; discussion 190-2, 261-4. Novartis Found Symp. 2002. PMID: 12027007 Review.
Cited by
- A broad survey of choanoflagellates revises the evolutionary history of the Shaker family of voltage-gated K+ channels in animals.
Jegla T, Simonson BT, Spafford JD. Jegla T, et al. Proc Natl Acad Sci U S A. 2024 Jul 23;121(30):e2407461121. doi: 10.1073/pnas.2407461121. Epub 2024 Jul 17. Proc Natl Acad Sci U S A. 2024. PMID: 39018191 - Functional analysis of ctenophore Shaker K+ channels: N-type inactivation in the animal roots.
Simonson BT, Jegla M, Ryan JF, Jegla T. Simonson BT, et al. Biophys J. 2024 Jul 16;123(14):2038-2049. doi: 10.1016/j.bpj.2024.01.027. Epub 2024 Jan 30. Biophys J. 2024. PMID: 38291751 - Genome-Scale Analysis Reveals Extensive Diversification of Voltage-Gated K+ Channels in Stem Cnidarians.
Lara A, Simonson BT, Ryan JF, Jegla T. Lara A, et al. Genome Biol Evol. 2023 Mar 3;15(3):evad009. doi: 10.1093/gbe/evad009. Genome Biol Evol. 2023. PMID: 36669828 Free PMC article. - Cryo-EM structure of the human Kv3.1 channel reveals gating control by the cytoplasmic T1 domain.
Chi G, Liang Q, Sridhar A, Cowgill JB, Sader K, Radjainia M, Qian P, Castro-Hartmann P, Venkaya S, Singh NK, McKinley G, Fernandez-Cid A, Mukhopadhyay SMM, Burgess-Brown NA, Delemotte L, Covarrubias M, Dürr KL. Chi G, et al. Nat Commun. 2022 Jul 15;13(1):4087. doi: 10.1038/s41467-022-29594-w. Nat Commun. 2022. PMID: 35840580 Free PMC article. - Pentameric assembly of the Kv2.1 tetramerization domain.
Xu Z, Khan S, Schnicker NJ, Baker S. Xu Z, et al. Acta Crystallogr D Struct Biol. 2022 Jun 1;78(Pt 6):792-802. doi: 10.1107/S205979832200568X. Epub 2022 May 30. Acta Crystallogr D Struct Biol. 2022. PMID: 35647925 Free PMC article.
References
- Hannenhalli, S. S. & Russell, R. B. (2000) J. Mol. Biol. 303, 61–76. - PubMed
- Livingstone, C. D. & Barton, G. J. (1993) Comput. Appl. Biosci. 9, 745–756. - PubMed
- Lichtarge, O., Bourne, H. R. & Cohen, F. E. (1996) J. Mol. Biol. 257, 342–358. - PubMed
- Casari, G., Sander, C. & Valencia, A. (1995) Nat. Struct. Biol. 2, 171–178. - PubMed
Publication types
MeSH terms
Substances
Grants and funding
- NS37444/NS/NINDS NIH HHS/United States
- P01 NS037444/NS/NINDS NIH HHS/United States
- GM56653/GM/NIGMS NIH HHS/United States
- P30 HD024064/HD/NICHD NIH HHS/United States
- NS31583/NS/NINDS NIH HHS/United States
- R01 GM056653/GM/NIGMS NIH HHS/United States
- R01 NS031583/NS/NINDS NIH HHS/United States
- HD24064/HD/NICHD NIH HHS/United States
LinkOut - more resources
Full Text Sources
Molecular Biology Databases


