Bidirectional interactions between antigen-bearing respiratory tract dendritic cells (DCs) and T cells precede the late phase reaction in experimental asthma: DC activation occurs in the airway mucosa but not in the lung parenchyma - PubMed (original) (raw)
Bidirectional interactions between antigen-bearing respiratory tract dendritic cells (DCs) and T cells precede the late phase reaction in experimental asthma: DC activation occurs in the airway mucosa but not in the lung parenchyma
Joong C Huh et al. J Exp Med. 2003.
Abstract
The airway mucosal response to allergen in asthma involves influx of activated T helper type 2 cells and eosinophils, transient airflow obstruction, and airways hyperresponsiveness (AHR). The mechanism(s) underlying transient T cell activation during this inflammatory response is unclear. We present evidence that this response is regulated via bidirectional interactions between airway mucosal dendritic cells (AMDC) and T memory cells. After aerosol challenge, resident AMDC acquire antigen and rapidly mature into potent antigen-presenting cells (APCs) after cognate interactions with T memory cells. This process is restricted to dendritic cells (DCs) in the mucosae of the conducting airways, and is not seen in peripheral lung. Within 24 h, antigen-bearing mature DCs disappear from the airway wall, leaving in their wake activated interleukin 2R+ T cells and AHR. Antigen-bearing activated DCs appear in regional lymph nodes at 24 h, suggesting onward migration from the airway. Transient up-regulation of CD86 on AMDC accompanies this process, which can be reproduced by coculture of resting AMDC with T memory cells plus antigen. The APC activity of AMDC can be partially inhibited by anti-CD86, suggesting that CD86 may play an active role in this process and/or is a surrogate for other relevant costimulators. These findings provide a plausible model for local T cell activation at the lesional site in asthma, and for the transient nature of this inflammatory response.
Figures
Figure 1.
In situ analysis of respiratory tract cell populations. (A–C) Tracheal epithelium stained for MHC class II. Sections were taken at (A) 0, (B) 2, and (C) 24 h after OVA aerosol challenge of primed animals. Images are projections along the z axis (“top” view) from stacks of 30 optical sections acquired at 2-μm increments at ×100 magnification. (D) Tracheal sections from primed OVA/ALOH animals after OVA aerosol exposure, stained for eosinophils, T cells, and DCs. Cells were quantitated by light (Epithelial DC, T-cells, Eos) confocal microscopy (Submucosal DC). Data are mean ± SD from three to five observations for each cell type. (E) Lung tissue was isolated at the indicated time points after challenge and single cell suspensions were prepared and immunostained. DCs were enumerated by flow cytometry and results were expressed as numbers recovered per gram wet weight (mean ± SD from three experiments).
Figure 2.
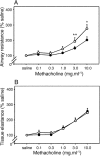
AHR after exposure to aerosolized OVA. Sensitized animals (n = 6 per group; ○) together with naive controls (•) were exposed to aerosolized OVA, and 24 h later MCh challenge was performed. The top shows a left shift in the airway dose response curve to MCh contrasted with no change in parenchymal responsiveness (bottom). Differences between test and control groups in this experiment (and in Figs. 3–6) were analyzed by Student's t test. *, P < 0.01; **, P < 0.05.
Figure 3.
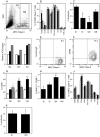
Flow cytometric analysis of DCs after OVA aerosol challenge of OVA-primed animals. Data are representative of a series (A, E, and F) or mean ± SE from three to five experiments. (A) Flow cytometric analysis of total tracheal digest cells indicating gating for total DCs (R1) and subregions (R2–R4), based on SSC and MHC class II expression profiles. (B) Surface marker expression (after correction for background staining with isotype control) in total MHC class II+ DC populations (R1) in the trachea at 0 (open bars), 2 (solid bars), and 24 h (hatched bars) after challenge (*, P < 0.01 compared with 0 and 24 h). (C) Endocytic activity of R1 tracheal DCs at 2, 24, and 48 h after challenge as determined by 10-min dextran FITC uptake with trypan blue quenching at 37°C minus uptake at 4°C. Activity was significantly reduced relative to unexposed animals (0 h). *, P < 0.04; **, P < 0.01. (D) Relative numeric changes in tracheal DCs within each gating region at 2 (solid bars) and 24 h (hatched bars) after challenge compared with control immunized, nonaerosol challenged animals (open bars). (E and F) Expression of CD86 and MHC class II by R4 tracheal DCs at 2 h after challenge. Nonspecific binding of isotype control (E) versus staining with anti-CD86 on the MHC class IIhi subset. (G) Changes in CD86 expression on tracheal DCs in subregions R2–R4 as designated in A and D. Significance of increase relative to 0 h. *, P < 0.01; **, P < 0.001. (H) Flow cytometry analysis of DCs in PTLN after aerosol challenge of sensitized animals. The gating strategy comprised initial selection of total DCs (as per R1 in A), followed sequentially by gating for high MHC class II and low isotype control binding, and the same gates applied directly to obtain percentage of CD86 expression (see Fig. S5, available at
http://www.jem.org/cgi/content/full.jem.20021328/DC1
). MHC class IIhi CD86hi DCs are shown as percentage of total DCs at 0 h compared with animals at 2, 24, and 48 h after challenge. >0 h: *, P < 0.01; **, P < 0.001. (J) Surface marker expressions by R1 DCs in the parenchymal lung at 0 (open bars), 2 (solid bars), and 24 h (hatched bars) after challenge. (K) Endocytic activity of R1 parenchymal lung DCs at 24 h after challenge compared to unexposed animals (t0), determined as per C.
Figure 4.
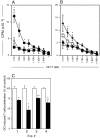
Antigen presentation by purified airway and lymph node DCs. Purified DCs from challenged animals were used to stimulate a CD4+ OVA-specific T cell line for 48 h. T cell stimulation (3H-DNA synthesis as CPM/culture) is shown as mean ± SE from three or more experiments (A and B) or from individual experiments (C). (A) OVA presentation by tracheal DCs isolated from OVA-immune animals 2 (•) and 24 h (▪) after challenge, or from naive animals 2 h (⋄) after challenge. 2 h > 0 h and 24 h: *, P < 0.05–0.01. (B) Total PTLN DCs were purified at 2 (•) or 24 h (□) after OVA aerosol challenge and additionally, sorted into MHC class IIhi (♦) or MHC class IIlow (▵) expressing cells (as per Fig. 3) at the 24-h time point. OVA presentation by PTLN DCs is maximal at 24 h after aerosol challenge and was restricted to the MHC class IIhi population of DCs. (C) Tracheal DCs isolated 2 h after challenge were used to stimulate OVA-specific T cells in the absence (□) or presence (▪) of blocking antibody to CD86. In experiments 3 and 4, control cultures contained isotype control mAb versus medium only in control cultures in experiments 1 and 2. Data are normalized against the OVA-specific T cell response (3H-DNA synthesis at 72 h) in the absence of blocking antibody. <control: *, P < 0.05; **, P < 0.01.
Figure 5.
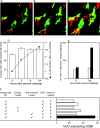
DC–T cell interactions in airway mucosa. (A–C) Confocal microscopy of tracheal sections 2 h after challenge of OVA-immune rats stained for MHC II (green, DCs) and TcRαβ (red, T cells). Dual staining contact points appear yellow. Each panel in the series represents a 1-μm optical section shown in ascending order, where individual DCs can be seen interacting with ≥1 T cells. (D) Individual T cells (n = 50–100) were scored for direct contact with DCs, and numbers in contact were expressed as a percentage of total T cells. Relative numbers of T cells at each time point were determined by factoring in data on absolute cell numbers per unit area of tissue from Fig. 1 D. *, P < 0.05 relative to 0 h, based on mean data from five experiments. (E) IL-2R+ T cells were initially enumerated as a percentage of total T cells by flow cytometric analysis of tracheal digests from exposed (solid bars) or control (open bars) animals in five experiments, and finally expressed as numbers of IL-2R+ T cells per unit area of epithelium by reference to data in Fig. 1 D, yielding five data points for each group at each time point. Data analysis used means derived from these data points. 24 h > 2 h in OVA-exposed animals: *, P < 0.05. (F) Tracheal DCs from naive animals were cultured alone or in the presence of either control or OVA-immune T cells at a density of 20:1 (T cell/DC). After the addition of 50 μg/ml soluble OVA, CD86 expression was examined (as in Fig. 3) at 0 and 3 or 4 h (data shown are for 3 h and are representative of a series of five experiments). Test culture (solid bar) > controls (open bars). *, P < 0.02 based on comparisons of means derived from five data points for each manipulation. Raw data from an exemplary experiment are illustrated in Fig. S9, available at
http://www.jem.org/cgi/content/full.jem.20021328/DC1
.
Figure 6.
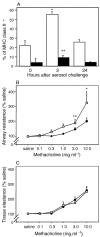
Responses to OVA aerosol challenge in rats primed for Th1 immunity with OVA/complete Freund's adjuvant. DCs from tracheal digests 2 and 24 h after challenge were immunostained as per Fig. 3. (A) illustrates time-dependent changes in CD80 (▪) and CD86 (□) expression after aerosol exposure. CD80/CD86+ DCs are shown as a percentage of total MHC class II+ DCs (mean ± SE from three experiments). Controls and gating strategies are as described in Fig. 3. MCh challenge was performed on parallel groups (n = 5) of control (•) and OVA/complete Freund's adjuvant–primed (○) animals. (B) illustrates a left shift in the MCh dose response curve, contrasting with no change in parenchymal responses shown in C. *, P < 0.01; **, P < 0.05.
Similar articles
- Reversal of airway hyperresponsiveness by induction of airway mucosal CD4+CD25+ regulatory T cells.
Strickland DH, Stumbles PA, Zosky GR, Subrata LS, Thomas JA, Turner DJ, Sly PD, Holt PG. Strickland DH, et al. J Exp Med. 2006 Nov 27;203(12):2649-60. doi: 10.1084/jem.20060155. Epub 2006 Nov 6. J Exp Med. 2006. PMID: 17088431 Free PMC article. - Essential role of dendritic cell CD80/CD86 costimulation in the induction, but not reactivation, of TH2 effector responses in a mouse model of asthma.
van Rijt LS, Vos N, Willart M, Kleinjan A, Coyle AJ, Hoogsteden HC, Lambrecht BN. van Rijt LS, et al. J Allergy Clin Immunol. 2004 Jul;114(1):166-73. doi: 10.1016/j.jaci.2004.03.044. J Allergy Clin Immunol. 2004. PMID: 15241361 - Mode of dendritic cell activation: the decisive hand in Th2/Th17 cell differentiation. Implications in asthma severity?
Vroman H, van den Blink B, Kool M. Vroman H, et al. Immunobiology. 2015 Feb;220(2):254-61. doi: 10.1016/j.imbio.2014.09.016. Epub 2014 Sep 16. Immunobiology. 2015. PMID: 25245013 Review. - Regulation of T helper cell differentiation by respiratory tract dendritic cells.
Stumbles PA. Stumbles PA. Immunol Cell Biol. 1999 Oct;77(5):428-33. doi: 10.1046/j.1440-1711.1999.00850.x. Immunol Cell Biol. 1999. PMID: 10540209 Review.
Cited by
- Activation of the D prostanoid 1 receptor suppresses asthma by modulation of lung dendritic cell function and induction of regulatory T cells.
Hammad H, Kool M, Soullié T, Narumiya S, Trottein F, Hoogsteden HC, Lambrecht BN. Hammad H, et al. J Exp Med. 2007 Feb 19;204(2):357-67. doi: 10.1084/jem.20061196. Epub 2007 Feb 5. J Exp Med. 2007. PMID: 17283205 Free PMC article. - CARMA3 Mediates Allergic Lung Inflammation in Response to Alternaria alternata.
Causton B, Pardo-Saganta A, Gillis J, Discipio K, Kooistra T, Rajagopal J, Xavier RJ, Cho JL, Medoff BD. Causton B, et al. Am J Respir Cell Mol Biol. 2018 Dec;59(6):684-694. doi: 10.1165/rcmb.2017-0181OC. Am J Respir Cell Mol Biol. 2018. PMID: 29958012 Free PMC article. - Photothermal therapy with immune-adjuvant nanoparticles together with checkpoint blockade for effective cancer immunotherapy.
Chen Q, Xu L, Liang C, Wang C, Peng R, Liu Z. Chen Q, et al. Nat Commun. 2016 Oct 21;7:13193. doi: 10.1038/ncomms13193. Nat Commun. 2016. PMID: 27767031 Free PMC article. - Importance of myeloid dendritic cells in persistent airway disease after repeated allergen exposure.
Koya T, Kodama T, Takeda K, Miyahara N, Yang ES, Taube C, Joetham A, Park JW, Dakhama A, Gelfand EW. Koya T, et al. Am J Respir Crit Care Med. 2006 Jan 1;173(1):42-55. doi: 10.1164/rccm.200505-783OC. Epub 2005 Sep 28. Am J Respir Crit Care Med. 2006. PMID: 16192450 Free PMC article. - Nonredundant role of CCRL2 in lung dendritic cell trafficking.
Otero K, Vecchi A, Hirsch E, Kearley J, Vermi W, Del Prete A, Gonzalvo-Feo S, Garlanda C, Azzolino O, Salogni L, Lloyd CM, Facchetti F, Mantovani A, Sozzani S. Otero K, et al. Blood. 2010 Oct 21;116(16):2942-9. doi: 10.1182/blood-2009-12-259903. Epub 2010 Jul 6. Blood. 2010. PMID: 20606167 Free PMC article.
References
- Holgate, S. 1998. The inflammation-repair cycle in asthma: the pivotal role of the airway epithelium. Clin. Exp. Allergy. 28:97–103. - PubMed
- Holloway, L.J., R. Beasley, W.R. Roche, and A.L. James. 2000. The pathology of fatal asthma. Asthma & Rhinitis, Volume 1. W.W. Busse and S.T. Holgate, editors. Blackwell Science Ltd, Oxford. 193–202.
- James, A.L., P.D. Paré, and J.C. Hogg. 1989. The mechanics of airway narrowing in asthma. Am. Rev. Respir. Dis. 139:242–246. - PubMed
- Corry, D.B., and F. Kheradmand. 1999. Induction and regulation of the IgE response. Nature. 402:B18–B23. - PubMed
Publication types
MeSH terms
Substances
LinkOut - more resources
Full Text Sources
Other Literature Sources
Medical
Miscellaneous

