Glucocorticoids play a fundamental role in protecting the brain during innate immune response - PubMed (original) (raw)
Glucocorticoids play a fundamental role in protecting the brain during innate immune response
Sylvain Nadeau et al. J Neurosci. 2003.
Abstract
The innate immune system plays a crucial role in protecting the host against infectious microorganisms. An inappropriate control of this system may have profound consequences, because of the maintained production of specific proinflammatory molecules. Glucocorticoids are the most efficient endogenous molecules that provide negative feedback on proinflammatory signaling and gene expression. Here we show that activation of this system is not detrimental for the brain but a profound neurodegeneration takes place in animals treated with the glucocorticoid receptor inhibitor Mifepristone (RU486). This drug increased the inflammatory reaction induced by a single intracerebral bolus of lipopolysaccharide (LPS). Inhibition of tumor necrosis factor alpha (TNF-alpha) totally abolished the neurotoxic effect of the endotoxin, and chronic infusion of the cytokine mimicked the treatment combining RU486 and LPS. The neuronal damage caused by TNF-alpha is dependent on both nitric oxide and caspase pathways. In controlling the cerebral innate immunity and microglial TNF-alpha production, glucocorticoids play a major role in protecting the brain against bacterial cell wall components.
Figures
Figure 1.
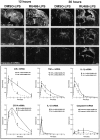
Time-related induction of genes encoding proinflammatory proteins and caspase-8 in the brain of rats that received a single bolus of lipopolysaccharide (LPS) in the dorsal striatum. Animals received a systemic injection with vehicle (DMSO) or the glucocorticoid receptor inhibitor RU486 12 hr before the intraparenchymal challenge with the endotoxin. The dark-field photomicrographs were taken from brain coronal sections hybridized with different radioactive riboprobes and dipped into nuclear emulsion milk (Kodak). The pictures of the first row depict representative examples of the expression pattern of the inhibitory factor κBα (IκBα; index of NF-κB activity) transcript 12 and 36 hr after an intracerebral LPS bolus in rats that were pretreated systemically with the vehicle DMSO or RU486. Those of the second row show examples of tumor necrosis factor α (TNF-α)-expressing cells, whereas coronal sections of the third row were hybridized with a rat caspase-8 cRNA probe. The O.D. was measured on x-ray films (Biomax, Kodak) from digitalized sections and subjected to densitometric analysis using a logarithmic specter of standardized O.D. yielding measurements of mean density per area. For more information on image analysis, see Materials and Methods. Results represent mean ± SEM for two (intrastriatal vehicle) or five (intrastriatal LPS) animals per group. Data were analyzed by a two-way ANOVA, followed by a Bonferroni/Dunn test procedure as post hoc comparison (Statview 4.01). There was a significant interaction between the two main independent variables. *p < 0.05 from their corresponding DMSO/vehicle groups; †p<0.05 from their corresponding RU486/vehicle and DMSO/LPS groups. Magnification, 3.125 ×. Scale bar, 1000 μm.
Figure 2.
A single intraparenchymal lipopolysaccharide (LPS) injection causes a major neurodegeneration in rats pretreated with RU486. Animals received an intraperitoneal injection of either vehicle solution (DMSO) or RU486 (50 mg/kg) 12 hr before the intracerebral infusion of either vehicle solution (saline) or LPS (5 μg/2 μl for 2 min). A, Panels depict representative examples of demyelination and necrotic tissues stained with Luxol Fast Blue. B, Panels show examples of Fluoro-Jade B staining used here as index of neurodegeneration. Apoptotic cells are depicted by the images in the panels in C (DNA fragmentation) and D (immunoreactive cleaved caspase-3 cells). The nonspecific staining is caused by the primary antisera, because no signal was found in tissues (from both control and treated rats) incubated without primary antibody. This staining is unlikely to reveal cleaved caspase-3 in control brains, because this enzyme and its substrates are not located in the nucleus but in the cytoplasm, as depicted by the apoptotic cells of the two right panels in D. E, Panels show the progressive destruction of the extracellular matrix, modification of the neuronal morphology, and appearance of infiltrating cells detected by means of the LFB staining. All photomicrographs were taken at the same rostrocaudal level. Black arrows indicate infiltrating cells; white arrows indicate neurons. Magnification: A, B, 3.125×; C_–_E, 100×. Scale bars: A, B, 1000 μm; C_–_E, 100 μm.
Figure 3.
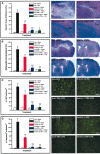
Role of interleukin 1 β (IL-1β) and tumor necrosis factorα (TNF-α) in the neurotoxic effects of lipopolysaccharide (LPS) in glucocorticoid receptor-deficient rats. Solutions containing an rIL-1β neutralizing antibody (2 μg/5 μl for 2 min), an rTNF-α neutralizing antibody (2 μg/5 μl for 2 min.), a mixture of both neutralizing antibodies (4 μg/5 μl for 2 min), or vehicle were infused into the dorsal basal ganglia 10 hr before the endotoxin challenge via the same route. These neutralizing antibodies were infused a second time just after the cerebral LPS treatment(5 μg/2 μl for 2 min), and rats were killed 7 d later. Please note that all the animals included in this analysis were treated with RU486 (50 mg/kg per 200μl) 12 hr before the LPS bolus to cause neurodegeneration. The necrotic area, extent of demyelination, number of Fluoro-Jade B (#FJB) neurons, and number of cleaved caspase-3-immunoreactive cells are depicted in A_–_D, respectively. The photomicrographs depict representative examples of the different histological preparations that were used to quantify the data. All photomicrographs were taken at the same rostrocaudal level. Results are expressed as mean ± SEM for two (Veh-Saline) or five animals per group. *p < 0.05 from their corresponding saline-treated groups. †p<0.05 from the Veh-LPS group. ‡p<0.05 from the anti-IL-1β-LPS group. CC, Corpus callosum; CeC, cerebral cortex; CPu, caudoputamen. Magnification: A, 10×; B, 3.125×; C, D, 100×. Scale bars: A, 125 μm; B, 1625μm; C, D, 50μm.
Figure 4.
Chronic infusion of tumor necrosis factor α (TNF-α) induces cerebral damage. The animals received a chronic infusion with either the vehicle solution or rrTNF-α (0.0052 μg/0.26 μl per hour) and were killed 3, 7, 14, and 21 d after implantation of the mini-osmotic pumps. A, Panels depict representative examples of demyelination and necrotic tissues stained with Luxol Fast Blue. B, Panels show examples of Fluoro-Jade B staining used here as an index of neurodegeneration. Apoptotic cells are depicted by the images in C (DNA fragmentation) and D (immunoreactive cleaved caspase-3 cells). The striosome-matrix organization of the striatum explains the unspecific staining for both terminal deoxynucleotidyl transferase-mediated biotinylated UTP nick end labeling and cleaved caspase-3. In contrast to the well defined staining over cells of TNF-α-treated rats (7days, 14 days), the signal over the striosomes is not cell specific and is attributable to anatomical properties of these structures. They can be detected with most staining procedures, including LFB (A, E). E, Panels show the progressive destruction of the extracellular matrix, modification of neuronal morphology, and appearance of infiltrating cells detected via LFB staining. All photomicrographs were taken at the same rostrocaudal level. Black arrows indicate infiltrating cells; white arrows indicate neurons. Magnification: A, B, 3.125×; C_–_E, 100× Scale bars: A, B, 1000 μm; C_–_E, 25 μm.
Figure 5.
Partial role of nitric oxide (NO) and caspase pathways in the neurotoxic effects of TNF-α chronically infused into the rat brain. The mini-osmotic pumps were filled with vehicle solution, the nonselective inhibitor of NOS
l
-NAME (4.167 μg/0.26 μl per hour), a mixture containing caspase-2 and caspase-8 inhibitors (3.125 μg/0.26 μl per hour), or a mixture of the three drugs with and without TNF-α (0.0052 μg/0.26 μl per hour). The animals were killed 14 d after the beginning of the infusion in the dorsal basal ganglia. The necrotic area, extent of demyelination, number of Fluoro-Jade B (# FJB) neurons, and number of cleaved caspase-3-immunoreactive cells are depicted in A_–_D, respectively. Results are expressed as mean ± SEM for two (Vehicle) or four animals per group. Data were analyzed by a two-way ANOVA, followed by a Bonferroni/Dunn test procedure as post hoc comparison (Statview 4.01). *p < 0.05 from their corresponding vehicle-treated groups. †p < 0.05 from the rrTNF-α-treated group. ‡p < 0.05 from the
l
-NAME + rrTNF-α-treated group.
Figure 6.
Neuroprotective action of glucocorticoids (GCs) during innate immune response. A single intracerebral bolus of lipopolysaccharide (LPS) causes a strong and transient production of proinflammatory cytokines by microglial cells. Tumor necrosis factor α (TNF-α) may further activate adjacent microglia to eliminate the invading pathogens. These events are rapidly down-regulated by GCs that inhibit gene expression at the transcription level. Without such endogenous feedback, microglial TNF-α production is exaggerated and becomes highly neurotoxic and causes cell death via both caspase and nitric oxide pathways. The hypothalamic–pituitary–adrenal (HPA) axis and endogenous release of GCs may therefore play a critical role in the fate (neuroprotection or neurotoxicity) of the innate immune response in the CNS. For details, please see Discussion.
Similar articles
- Polyamines play a critical role in the control of the innate immune response in the mouse central nervous system.
Soulet D, Rivest S. Soulet D, et al. J Cell Biol. 2003 Jul 21;162(2):257-68. doi: 10.1083/jcb.200301097. Epub 2003 Jul 14. J Cell Biol. 2003. PMID: 12860970 Free PMC article. - Glucocorticoids: protectors of the brain during innate immune responses.
Glezer I, Rivest S. Glezer I, et al. Neuroscientist. 2004 Dec;10(6):538-52. doi: 10.1177/1073858404263494. Neuroscientist. 2004. PMID: 15534039 Review. - Inflammatory Mechanisms and Oxidative Stress as Key Factors Responsible for Progression of Neurodegeneration: Role of Brain Innate Immune System.
Leszek J, Barreto GE, Gąsiorowski K, Koutsouraki E, Ávila-Rodrigues M, Aliev G. Leszek J, et al. CNS Neurol Disord Drug Targets. 2016;15(3):329-36. doi: 10.2174/1871527315666160202125914. CNS Neurol Disord Drug Targets. 2016. PMID: 26831258 Review.
Cited by
- Neonatal programming of the rat neuroimmune response: stimulus specific changes elicited by bacterial and viral mimetics.
Ellis S, Mouihate A, Pittman QJ. Ellis S, et al. J Physiol. 2006 Mar 15;571(Pt 3):695-701. doi: 10.1113/jphysiol.2005.102939. Epub 2006 Jan 19. J Physiol. 2006. PMID: 16423854 Free PMC article. - Markers of inflammation and stress distinguish subsets of individuals with schizophrenia and bipolar disorder.
Fillman SG, Sinclair D, Fung SJ, Webster MJ, Shannon Weickert C. Fillman SG, et al. Transl Psychiatry. 2014 Feb 25;4(2):e365. doi: 10.1038/tp.2014.8. Transl Psychiatry. 2014. PMID: 24569695 Free PMC article. - The HPA - Immune Axis and the Immunomodulatory Actions of Glucocorticoids in the Brain.
Bellavance MA, Rivest S. Bellavance MA, et al. Front Immunol. 2014 Mar 31;5:136. doi: 10.3389/fimmu.2014.00136. eCollection 2014. Front Immunol. 2014. PMID: 24744759 Free PMC article. Review. - Non-classical animal models for studying adrenal diseases: advantages, limitations, and implications for research.
Bilyalova A, Bilyalov A, Filatov N, Shagimardanova E, Kiyasov A, Vorontsova M, Gusev O. Bilyalova A, et al. Lab Anim Res. 2024 Jun 19;40(1):25. doi: 10.1186/s42826-024-00212-8. Lab Anim Res. 2024. PMID: 38898483 Free PMC article. Review. - Innate immunity and neuroinflammation.
Shastri A, Bonifati DM, Kishore U. Shastri A, et al. Mediators Inflamm. 2013;2013:342931. doi: 10.1155/2013/342931. Epub 2013 Jun 15. Mediators Inflamm. 2013. PMID: 23843682 Free PMC article. Review.
References
- Allan SM, Rothwell NJ ( 2001) Cytokines and acute neurodegeneration. Nat Rev Neurosci 2: 734–744. - PubMed
- Beg AA, Baltimore D ( 1996) An essential role for NF-kappaB in preventing TNF-alpha-induced cell death. Science 274: 782–784. - PubMed
- Chan FK, Siegel RM, Lenardo MJ ( 2000) Signaling by the TNF receptor superfamily and T cell homeostasis. Immunity 13: 419–422. - PubMed
- Ghosh S, Karin M ( 2002) Missing pieces in the NF-kappaB puzzle. Cell [Suppl] 109: S81–96. - PubMed
Publication types
MeSH terms
Substances
LinkOut - more resources
Full Text Sources
Medical


