Brain-derived neurotrophic factor mediates activity-dependent dendritic growth in nonpyramidal neocortical interneurons in developing organotypic cultures - PubMed (original) (raw)
Brain-derived neurotrophic factor mediates activity-dependent dendritic growth in nonpyramidal neocortical interneurons in developing organotypic cultures
Xiaoming Jin et al. J Neurosci. 2003.
Abstract
Brain-derived neurotrophic factor (BDNF) promotes postnatal maturation of GABAergic inhibition in the cerebral and cerebellar cortices, and its expression and release are enhanced by neuronal activity, suggesting that it acts in a feedback manner to maintain a balance between excitation and inhibition during development. BDNF promotes differentiation of cerebellar, hippocampal, and neostriatal inhibitory neurons, but its effects on the dendritic development of neocortical inhibitory interneurons remain unknown. Here, we show that BDNF mediates depolarization-induced dendritic growth and branching in neocortical interneurons. To visualize inhibitory interneurons, we biolistically transfected organotypic cortical slice cultures from neonatal mice with green fluorescent protein (GFP) driven by the glutamic acid decarboxylase (GAD)67 promoter. Nearly all GAD67-GFP-expressing neurons were nonpyramidal, many contained GABA, and some expressed markers of neurochemically defined GABAergic subtypes, indicating that GAD67-GFP-expressing neurons were GABAergic. We traced dendritic trees from confocal images of the same GAD67-GFP-expressing neurons before and after a 5 d growth period, and quantified the change in total dendritic length (TDL) and total dendritic branch points (TDBPs) for each neuron. GAD67-GFP-expressing neurons growing in control medium exhibited a 20% increase in TDL, but in 200 ng/ml BDNF or 10 mm KCl, this increase nearly doubled and was accompanied by a significant increase in TDBPs. Blocking action potentials with TTX did not prevent the BDNF-induced growth, but antibodies against BDNF blocked the growth-promoting effect of KCl. We conclude that BDNF, released by neocortical pyramidal neurons in response to depolarization, enhances dendritic growth and branching in nearby inhibitory interneurons.
Figures
Figure 3.
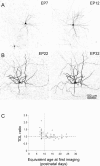
Dendritic growth of GAD67–GFP-expressing neurons in control medium occurred only in younger cultures. A, Confocal projection of a representative GAD67–GFP-expressing neuron first imaged at EP7 (left) and again 5 d later (right). B, Another neuron first imaged at EP22 (left) and again 10 d later (right). Scale bar: (in B) A, B, 100 μm. C, TDL growth ratio of all of the neurons in our sample during a 5 d period in normal medium, plotted against the equivalent age at first imaging. A TDL ratio of 1 (dashed line) indicates no change. Note that dendritic growth was observed in neurons first imaged at EP7–EP9 (left of the vertical dotted line), but there was no change on average in neurons first imaged at later ages (right of the vertical dotted line).
Figure 1.
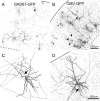
Neurons expressing GAD67–GFP were nonpyramidal, but neurons expressing CMV–GFP had mixed morphologies. A, C, Neurons labeled by transfection with GAD67–GFP, imaged at low (10×) and high (20×) power, respectively. B, D, Neurons labeled by transfection with CMV–GFP, imaged at low and high power, respectively. The images in A–D are from four different slices. Arrowhead in A points to a pair of apparently fused neurons; arrowheads in B indicate apical dendrites of pyramidal neurons. Arrows in C and D indicate the initial segment of the axon, which exits toward the pial surface in the interneuron (C) and toward the white matter in the pyramidal neuron (D). Solid lines in this and subsequent figures indicate the pial surface, and dashed lines indicate the border between layer 6 and the white matter. Scale bars: (in B) A, B, 200 μm; (in D) C, D, 100 μm.
Figure 2.
Some, but not all, of the GAD67–GFP-expressing neurons were immunopositive for GABA and GABAergic subtype markers. A, C, E, G, Dual-channel confocal images of immunofluorescence (pseudocolored red) and GAD67–GFP fluorescence (pseudocolored green). B, D, F, H, The same fields with immunofluorescence only. Immunostaining is for antibodies against GABA (A, B), GAD67 (C, D), and somatostatin (E–H). Arrows in B, D, F, and H indicate the location of the GFP-expressing neuron shown in A, C, E, and G, respectively. Note that the GFP-expressing neurons in A, C, and E were immunopositive, but the neuron in G was immunonegative. Light arrows in D indicate non-GFP-expressing immunopositive neurons. Scale bar: (in H) A, B, E–H, 100 μm; C, D, 40 μm. NCtx, Neocortex; S Oriens, stratum oriens; L. VI, layer 6. Solid and dashed lines are as described in Figure 1.
Figure 4.
GAD67–GFP fluorescence revealed the full dendritic morphology. GAD67–GFP-expressing neurons were imaged 3 weeks (A) or 3 d (B) after transfection and then injected with biocytin through a patch pipette. The 3-D reconstructions of the dendritic trees from the confocal images (green) are superimposed on the 3-D reconstructions from the biocytin tracings of the same neurons (red). Note that the GFP fluorescence was at least as extensive as the biocytin labeling, but one secondary dendrite in the younger neuron in B appeared shorter in the confocal image compared with the corresponding biocytin tracing (B, top tracing, arrow). The terminal part of the dendrite was missing from the confocal reconstruction, because it was located deep in the slice, as shown by the x_–_z image of the same neuron (B, bottom tracing, arrow). Scale bar, 100 μm (for both images).
Figure 5.
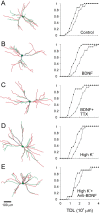
BDNF and KCl enhanced dendritic growth of GAD67–GFP-expressing neurons. Left column, Morphological reconstructions of representative dendritic trees of neurons before (green) and after (red) a 5 d period in culture medium supplemented by one of the following: no supplement (A), 200 ng/ml BDNF (B), 200 ng/ml BDNF and 1 μ
m
TTX (C), 10 m
m
KCl (D), or 10 m
m
KCl and 50 μg/ml anti-BDNF (E). Right column, Cumulative histogram of TDL in each treatment group; each data point represents the fraction of neurons in the treatment group with TDL values equal to or smaller than the corresponding x value. •, TDL at day 0 (before treatment). ▵, TDL at day 5 (after treatment). Note that the rightward shift of the curves (indicating an overall increase in total dendritic length) was considerably larger in B, C, and D, compared with control. Scale bar, 100 μm (for all images).
Figure 6.
Summary and statistical analysis of the effects of all of the tested treatments on dendritic growth and branching. Ratio change in TDL (left) and TDBPs (right) after 5 d of the treatment indicated. Each box spans the 25th to 75th percentile of the data points, with the median represented by a vertical line inside the box; the whiskers span the 5th to 95th percentiles. The number of neurons tested is indicated in parentheses after the treatment label. The dashed vertical lines at x = 1 indicate no change. (*)p < 0.1, *p < 0.05, **p < 0.01, ***p < 0.005; p values are from pairwise comparisons with the control group.
Figure 7.
Sholl analysis reveals a similar pattern of dendritic growth in response to BDNF and KCl. Absolute increase in TDL in the control (○), high K+ (▴), and BDNF (□) groups was calculated separately for each consecutive, 20 μm-wide concentric ring, and averaged between neurons. Note that the high K+ and BDNF groups exhibited a greater average increase in TDL, compared with control, but the radial extent of the increase was similar among all three groups. Error bars represent SEMs.
Figure 8.
BDNF mediates a feedback loop that maintains a balance between excitation and inhibition. Left, A pyramidal neuron is assumed to be depolarized (+), causing it to increase its firing rate and thereby release more BDNF into the extracellular space, acting on TrkB receptors in a nearby inhibitory neuron. (Although this figure implies that BDNF is released from dendrites, BDNF may also be released from axon terminals.) Right, The released BDNF caused the inhibitory interneuron to ramify its dendritic and axonal arbors and thereby increase its inhibitory effect on the pyramidal cell (–) counteracting the initial depolarization.
Similar articles
- Vertical bias in dendritic trees of non-pyramidal neocortical neurons expressing GAD67-GFP in vitro.
Jin X, Mathers PH, Szabo G, Katarova Z, Agmon A. Jin X, et al. Cereb Cortex. 2001 Jul;11(7):666-78. doi: 10.1093/cercor/11.7.666. Cereb Cortex. 2001. PMID: 11415968 - Neuronal activity and brain-derived neurotrophic factor regulate the density of inhibitory synapses in organotypic slice cultures of postnatal hippocampus.
Marty S, Wehrlé R, Sotelo C. Marty S, et al. J Neurosci. 2000 Nov 1;20(21):8087-95. doi: 10.1523/JNEUROSCI.20-21-08087.2000. J Neurosci. 2000. PMID: 11050130 Free PMC article. - Brain-derived neurotrophic factor acutely depresses excitatory synaptic transmission to GABAergic neurons in visual cortical slices.
Jiang B, Kitamura A, Yasuda H, Sohya K, Maruyama A, Yanagawa Y, Obata K, Tsumoto T. Jiang B, et al. Eur J Neurosci. 2004 Aug;20(3):709-18. doi: 10.1111/j.1460-9568.2004.03523.x. Eur J Neurosci. 2004. PMID: 15255981 - Neurotrophins and activity-dependent plasticity of cortical interneurons.
Marty S, Berzaghi MdaP, Berninger B. Marty S, et al. Trends Neurosci. 1997 May;20(5):198-202. doi: 10.1016/s0166-2236(96)01026-0. Trends Neurosci. 1997. PMID: 9141194 Review. - Neocortical inhibitory system.
Druga R. Druga R. Folia Biol (Praha). 2009;55(6):201-17. Folia Biol (Praha). 2009. PMID: 20163769 Review.
Cited by
- Kif21B mediates the effect of estradiol on the morphological plasticity of mouse hippocampal neurons.
Ganchala D, Pinto-Benito D, Baides E, Ruiz-Palmero I, Grassi D, Arevalo MA. Ganchala D, et al. Front Mol Neurosci. 2023 Apr 3;16:1143024. doi: 10.3389/fnmol.2023.1143024. eCollection 2023. Front Mol Neurosci. 2023. PMID: 37078090 Free PMC article. - BDNF Therapeutic Mechanisms in Neuropsychiatric Disorders.
Bazzari AH, Bazzari FH. Bazzari AH, et al. Int J Mol Sci. 2022 Jul 29;23(15):8417. doi: 10.3390/ijms23158417. Int J Mol Sci. 2022. PMID: 35955546 Free PMC article. Review. - Loss of KCC2 in GABAergic Neurons Causes Seizures and an Imbalance of Cortical Interneurons.
Zavalin K, Hassan A, Fu C, Delpire E, Lagrange AH. Zavalin K, et al. Front Mol Neurosci. 2022 Mar 16;15:826427. doi: 10.3389/fnmol.2022.826427. eCollection 2022. Front Mol Neurosci. 2022. PMID: 35370549 Free PMC article. - Chronic partial TrkB activation reduces seizures and mortality in a mouse model of Dravet syndrome.
Gu F, Parada I, Yang T, Longo FM, Prince DA. Gu F, et al. Proc Natl Acad Sci U S A. 2022 Feb 15;119(7):e2022726119. doi: 10.1073/pnas.2022726119. Proc Natl Acad Sci U S A. 2022. PMID: 35165147 Free PMC article. - Deletion of TrkB in parvalbumin interneurons alters cortical neural dynamics.
Lau CG, Zhang H, Murthy VN. Lau CG, et al. J Cell Physiol. 2022 Jan;237(1):949-964. doi: 10.1002/jcp.30571. Epub 2021 Sep 7. J Cell Physiol. 2022. PMID: 34491578 Free PMC article.
References
- Agmon A, O'Dowd DK ( 1992) NMDA receptor-mediated currents are prominent in the thalamocortical synaptic response before maturation of inhibition. J Neurophysiol 68: 345–349. - PubMed
- Aguado F, Carmona MA, Pozas E, Aguilo A, Martinez-Guijarro FJ, Alcantara S, Borrell V, Yuste R, Ibanez CF, Soriano E ( 2003) BDNF regulates spontaneous correlated activity at early developmental stages by increasing synaptogenesis and expression of the K+/Cl – co-transporter KCC2. Development 130: 1267–1280. - PubMed
- Alcantara S, Ferrer I, Soriano E ( 1993) Postnatal development of parvalbumin and calbindin D28K immunoreactivities in the cerebral cortex of the rat. Anat Embryol (Berl) 188: 63–73. - PubMed
- Altar CA, Cai N, Bliven T, Juhasz M, Conner JM, Acheson AL, Lindsay RM, Wiegand SJ ( 1997) Anterograde transport of brain-derived neurotrophic factor and its role in the brain. Nature 389: 856–860. - PubMed
Publication types
MeSH terms
Substances
LinkOut - more resources
Full Text Sources


