WAVE2 deficiency reveals distinct roles in embryogenesis and Rac-mediated actin-based motility - PubMed (original) (raw)
. 2003 Jul 15;22(14):3602-12.
doi: 10.1093/emboj/cdg350.
Narcisa Martinez-Quiles, Sharon Eden, Tomoyuki Shibata, Fuminao Takeshima, Reiko Shinkura, Yuko Fujiwara, Roderick Bronson, Scott B Snapper, Marc W Kirschner, Raif Geha, Fred S Rosen, Frederick W Alt
Affiliations
- PMID: 12853475
- PMCID: PMC165620
- DOI: 10.1093/emboj/cdg350
WAVE2 deficiency reveals distinct roles in embryogenesis and Rac-mediated actin-based motility
Catherine Yan et al. EMBO J. 2003.
Abstract
The Wiskott-Aldrich syndrome related protein WAVE2 is implicated in the regulation of actin-cytoskeletal reorganization downstream of the small Rho GTPase, Rac. We inactivated the WAVE2 gene by gene-targeted mutation to examine its role in murine development and in actin assembly. WAVE2-deficient embryos survived until approximately embryonic day 12.5 and displayed growth retardation and certain morphological defects, including malformations of the ventricles in the developing brain. WAVE2-deficient embryonic stem cells displayed normal proliferation, whereas WAVE2-deficient embryonic fibroblasts exhibited severe growth defects, as well as defective cell motility in response to PDGF, lamellipodium formation and Rac-mediated actin polymerization. These results imply a non-redundant role for WAVE2 in murine embryogenesis and a critical role for WAVE2 in actin-based processes downstream of Rac that are essential for cell movement.
Figures
Fig. 1. Murine WAVE2 RNA expression and targeted disruption of WAVE2 in mice and cells. (A) Diagram of murine WAVE2 genomic locus and targeting strategy. The physical map of the entire WAVE2 genomic locus containing all eight exons is shown. Exons are indicated by small rectangular boxes. Genomic DNA fragments used to generate the targeting construct are hatched. The neomycin-resistance (Neor) and thymidine kinase (TK) genes used for positive and negative selections, the 5′ and 3′ probes, and the _Xba_1 restriction sites used for screening embryonic stem (ES) cell transfectants by Southern blot analyses are labeled. Deletion of the loxP-flanked _neo_r cassette leaves a single loxP site and the GFP downstream of an intra-ribosomal entry sequence (IRES). (B) Generation of WAVE2+/neo, WAVE2neo/neo and WAVE2–/neo ES cells and germline mice. Using the 5′ probe noted in the schematic in (A), homologous recombination results in the loss of a single 7.6 kb band and the appearance of a 8.6 kb targeted band or a 7 kb Cre deleted band. Genotypes of germline WAVE2+/neo mice born from mating a WAVE2 chimeric male and a 129sv/ev wild-type female are shown. (C) Loss of WAVE2 protein and RNA expression in WAVE2-deficient ES cells. Western blot analyses of protein extracts from wild-type (+/+), WAVE2+/neo (+/neo) and WAVE2neo/neo (neo/neo) ES cells. WAVE2 runs at the 84 kDa molecular weight marker and is absent in WAVE2-deficient ES cells. Equal protein loading was determined using an antibody to Ku86 (Santa Cruz). Northern blot analysis was determined using a WAVE2 cDNA probe. Equal RNA loading was determined with a β-actin control probe.
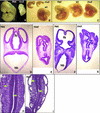
Fig. 2. WAVE2 deficiency results in mild to severe growth retardation and profound morphological defects in embryos. (A–C) Micrographs of E11–E12 wild-type (wt), WAVE2+/neo (Het) and WAVE2_neo_/neo (mut) embryos derived from F1 WAVE+/neo matings. Embryo littermates were photographed together at 20× (B and C) or 40× (A) magnification. The micrograph in (A) shows embryos fixed in Bouin’s Solution (Sigma); (B) and (C) show micrographs of unfixed embryos. Distinct growth retardations of mut versus wt embryos are apparent in (A) and (B). Branchial arches, limb buds, somites (A, B and C) and blood (B and C) are apparent. In (C), the mut embryo is comparable in size to wt and Het littermates but displays distinct conformational abnormalities: decreased size and malformation of cephalic (head) and caudal extremities and increased hemorrhaging. (D–I) High-powered hematoxylin-eosin staining of the transverse sections of WAVE2+/neo (Het) and WAVE2_neo_/neo (mut) embryo littermates. (D, E, F and G) Transverse section of 6–7 µm thickness taken from the cephalic region of WAVE2+/neo (D and F) and WAVE2_neo_/neo (E and G). The forebrain (fb) is oriented at the top and the hindbrain (hb) at the bottom. More anterior section (D and E) displaying the three ventricles of the forebrain (fb) and later sections (F and G) displaying lens and cheek formation are shown. Significant malformations of ventricles in both the forebrain and hindbrain are apparent. (H and I) Transverse section of WAVE2+/neo (H) and WAVE2_neo_/neo (I) caudal somites. Arrows point to two of several regions that display unusual detachment of cells.
Fig. 3. Growth rate of WAVE2-deficient cell lines. (A) Comparison of the growth rate of primary mouse embryonic fibroblasts (MEFs) derived from E11 embryo littermates, one wild-type (376-3+/+), two WAVE2+/neo (376-5+/– and 376-9+/–) and three WAVE2neo/neo MEFs (376-1–/–, 376-6–/– and 376-8–/–), and the growth rates of primary MEFs, untransduced (44–/– and 61-12–/–) or transduced with retrovirus expressing GFP (WTRVGFP and 44–/–RVGFP) or the WAVE2–GFP (61-12–/–RVW2 and 44–/–RVW2). Early passage cells were plated at 2 × 10⁴ per well in a 6-well dish in triplicate fashion. Cells were counted every 2 days up to 9 days in two independent experiments. The average of each experimental point with standard error bars is shown (hatched bars). Additional growth curves of primary MEFs derived from E9.5 embryo littermates gave similar results (data not shown). (B) The growth rate of WAVE2-deficient (KO) embryonic stem (ES) cells containing or lacking the loxP-flanked _neo_r cassette are compared with wild-type (WT) and two Het ES cell lines. The genotypes of the ES cell lines are depicted. ES cells, depleted of MEFs, were plated at 2 × 10⁴ cells per well in a 6-well dish and counted in triplicate as described above. The average of each experimental point with standard error bars is shown (hatched bars). (C) Flow cytometric analyses of FITC-Annexin V binding versus Topro 3 uptake in WT versus KO MEFs. Upper left, damaged cells (Annexin V–, Topro 3+); lower left, live cells (Annexin V–, Topro 3–); upper right, late apoptotic and dead cells (Annexin V+, Topro 3+); lower right, early apoptotic cells (Annexin V+, Topro 3–). Numbers represent the average of three experiments. (D) WAVE2 KO MEFs contain fewer replicating cells. WT and KO MEFs were pulsed for 1.5 h with 20 µM bromodeoxyuridine (BrdU) and analyzed by flow cytometry. The average percentage of labeled cells among total live cells from three experiments is indicated by the box. (E) Kinetics of BrdU incorporation of WT versus KO MEFs. MEFs were continuously labeled with 100 µM BrdU for 48 h and analyzed by flow cytometry. The average percentage of BrdU-labeled cells among total live cells from three experiments with standard error bars is plotted at each time point.
Fig. 4. WAVE2 is essential for lamellipodium and ruffle formation in mouse embryonic fibroblasts (MEFs). (A) Sub-confluent serum-starved wild-type (WT) and WAVE2 knockout (KO) MEFs were left unstimulated or stimulated with 20 ng/ml PDGF for 10 min. The leading edge and other areas of lamellipodia and ruffles are more obvious by cortactin staining (green panels) and detection of F-actin cytoskeleton by TRITC-phalloidin (red panels). KO cells show more distinct cytoskeletal defects. Note the absence of leading edge and aberrant lamellipodia formation (yellow arrows point to leading edge of lamellipodia) in unstimulated KO cells compared with WT cells. PDGF induces lamellipodia (yellow arrows), and circular ruffles (blue arrows) in KO MEFs are structurally malformed. Scale bar, 10 µm. (B) WAVE2 retroviral expression rescues the defect in lamellipodium formation. WAVE2 KO MEFs transduced with WAVE2 retrovirus (RVWAVE2), left unstimulated or stimulated with 20 ng/ml PDGF for 10 min. Cortactin staining is shown in red and F-actin in blue. Rescued KO MEFs exhibit a normal morphology with well-defined lamellipodium areas. (C) Membrane ruffle formation of WT, KO and Rescue (KO MEFs rescued with the WAVE2 retrovirus). One hundred cells of each condition were counted. Membrane ruffles are broken down into two distinct categories: lamellipodia and circular ruffles. Numbers represent an average of more than eight independent experiments performed for WT and KO and more than three experiments for the Rescue conditions. The average of these conditions with standard error bars is shown. (D) The chemotactic response of WT and KO primary MEFs to PDGF was examined under conditions containing (+PDGF) or lacking (-PDGF) PDGF at 10 ng/ml. The graph depicts the average of three experiments (42 fields of cells per condition) counted at two magnifications.
Fig. 4. WAVE2 is essential for lamellipodium and ruffle formation in mouse embryonic fibroblasts (MEFs). (A) Sub-confluent serum-starved wild-type (WT) and WAVE2 knockout (KO) MEFs were left unstimulated or stimulated with 20 ng/ml PDGF for 10 min. The leading edge and other areas of lamellipodia and ruffles are more obvious by cortactin staining (green panels) and detection of F-actin cytoskeleton by TRITC-phalloidin (red panels). KO cells show more distinct cytoskeletal defects. Note the absence of leading edge and aberrant lamellipodia formation (yellow arrows point to leading edge of lamellipodia) in unstimulated KO cells compared with WT cells. PDGF induces lamellipodia (yellow arrows), and circular ruffles (blue arrows) in KO MEFs are structurally malformed. Scale bar, 10 µm. (B) WAVE2 retroviral expression rescues the defect in lamellipodium formation. WAVE2 KO MEFs transduced with WAVE2 retrovirus (RVWAVE2), left unstimulated or stimulated with 20 ng/ml PDGF for 10 min. Cortactin staining is shown in red and F-actin in blue. Rescued KO MEFs exhibit a normal morphology with well-defined lamellipodium areas. (C) Membrane ruffle formation of WT, KO and Rescue (KO MEFs rescued with the WAVE2 retrovirus). One hundred cells of each condition were counted. Membrane ruffles are broken down into two distinct categories: lamellipodia and circular ruffles. Numbers represent an average of more than eight independent experiments performed for WT and KO and more than three experiments for the Rescue conditions. The average of these conditions with standard error bars is shown. (D) The chemotactic response of WT and KO primary MEFs to PDGF was examined under conditions containing (+PDGF) or lacking (-PDGF) PDGF at 10 ng/ml. The graph depicts the average of three experiments (42 fields of cells per condition) counted at two magnifications.
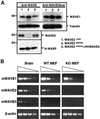
Fig. 5. (A) Western blot detection of WAVE1, WAVE2 and N-WASP in wild-type (WT) and knockout (KO) mouse embryonic fibroblasts (MEFs). The genotypes of the MEFs examined are depicted. The 84 kDa standard protein marker is shown. (B) RT–PCR analyses of WAVE1, WAVE2 and WAVE3 expression levels in WT and KO MEFs and in brain. β-actin is used as a control. PCRs were performed with 5-fold dilution of cDNAs from left to right.
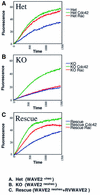
Fig. 6. GST–Cdc42 or GST–Rac induced actin polymerization in WAVE2-deficient cell extracts. Kinetics of actin polymerization in the absence (blue) or presence of GTPγS-charged GST-Rac (green) or GTPγS-charged GST–Cdc42 (red). (A) Het (WAVE2+/neo); (B) KO (WAVE2_neo_/neo); (C) Rescue (WAVE2_neo_/neo+RVWAVE2).
Similar articles
- PtdIns(3,4,5)P3 binding is necessary for WAVE2-induced formation of lamellipodia.
Oikawa T, Yamaguchi H, Itoh T, Kato M, Ijuin T, Yamazaki D, Suetsugu S, Takenawa T. Oikawa T, et al. Nat Cell Biol. 2004 May;6(5):420-6. doi: 10.1038/ncb1125. Epub 2004 Apr 25. Nat Cell Biol. 2004. PMID: 15107862 - Rac-WAVE-mediated actin reorganization is required for organization and maintenance of cell-cell adhesion.
Yamazaki D, Oikawa T, Takenawa T. Yamazaki D, et al. J Cell Sci. 2007 Jan 1;120(Pt 1):86-100. doi: 10.1242/jcs.03311. Epub 2006 Dec 12. J Cell Sci. 2007. PMID: 17164293 - Rac-WAVE2 signaling is involved in the invasive and metastatic phenotypes of murine melanoma cells.
Kurisu S, Suetsugu S, Yamazaki D, Yamaguchi H, Takenawa T. Kurisu S, et al. Oncogene. 2005 Feb 17;24(8):1309-19. doi: 10.1038/sj.onc.1208177. Oncogene. 2005. PMID: 15608687 - Wiskott-Aldrich syndrome: a disorder of haematopoietic cytoskeletal regulation.
Thrasher AJ, Burns S. Thrasher AJ, et al. Microsc Res Tech. 1999 Oct 15;47(2):107-13. doi: 10.1002/(SICI)1097-0029(19991015)47:2<107::AID-JEMT3>3.0.CO;2-H. Microsc Res Tech. 1999. PMID: 10523789 Review. - WASP and WAVE family proteins: key molecules for rapid rearrangement of cortical actin filaments and cell movement.
Takenawa T, Miki H. Takenawa T, et al. J Cell Sci. 2001 May;114(Pt 10):1801-9. doi: 10.1242/jcs.114.10.1801. J Cell Sci. 2001. PMID: 11329366 Review.
Cited by
- WAVE2 Regulates Actin-Dependent Processes Induced by the B Cell Antigen Receptor and Integrins.
Bedi A, Choi K, Keane C, Bolger-Munro M, Ambrose AR, Gold MR. Bedi A, et al. Cells. 2023 Nov 25;12(23):2704. doi: 10.3390/cells12232704. Cells. 2023. PMID: 38067132 Free PMC article. - WAVE2 Is a Vital Regulator in Myogenic Differentiation of Progenitor Cells through the Mechanosensitive MRTFA-SRF Axis.
Nguyen MT, Ly QK, Kim HJ, Lee W. Nguyen MT, et al. Cells. 2023 Dec 20;13(1):9. doi: 10.3390/cells13010009. Cells. 2023. PMID: 38201213 Free PMC article. - High-resolution X-ray structure of the trimeric Scar/WAVE-complex precursor Brk1.
Linkner J, Witte G, Stradal T, Curth U, Faix J. Linkner J, et al. PLoS One. 2011;6(6):e21327. doi: 10.1371/journal.pone.0021327. Epub 2011 Jun 20. PLoS One. 2011. PMID: 21701600 Free PMC article. - WHIMP links the actin nucleation machinery to Src-family kinase signaling during protrusion and motility.
Kabrawala S, Zimmer MD, Campellone KG. Kabrawala S, et al. PLoS Genet. 2020 Mar 20;16(3):e1008694. doi: 10.1371/journal.pgen.1008694. eCollection 2020 Mar. PLoS Genet. 2020. PMID: 32196488 Free PMC article. - Endothelial cells use dynamic actin to facilitate lymphocyte transendothelial migration and maintain the monolayer barrier.
Mooren OL, Li J, Nawas J, Cooper JA. Mooren OL, et al. Mol Biol Cell. 2014 Dec 15;25(25):4115-29. doi: 10.1091/mbc.E14-05-0976. Epub 2014 Oct 29. Mol Biol Cell. 2014. PMID: 25355948 Free PMC article.
References
- Bailly M. and Condeelis,J. (2002) Cell motility: insights from the backstage. Nat. Cell Biol., 4, E292–E294. - PubMed
- Benachenhou N., Massy,I. and Vacher,J. (2002) Characterization and expression analyses of the mouse Wiskott–Aldrich Syndrome Protein (WASP) family member Wave1/Scar. Gene, 290, 131–140. - PubMed
- Chen F. et al. (2000) Cdc42 is required for PIP(2)-induced actin polymerization and early development but not for cell viability. Curr. Biol., 10, 758–765. - PubMed
Publication types
MeSH terms
Substances
LinkOut - more resources
Full Text Sources
Other Literature Sources
Molecular Biology Databases
Miscellaneous


