GATA-1-dependent transcriptional repression of GATA-2 via disruption of positive autoregulation and domain-wide chromatin remodeling - PubMed (original) (raw)
GATA-1-dependent transcriptional repression of GATA-2 via disruption of positive autoregulation and domain-wide chromatin remodeling
Jeffrey A Grass et al. Proc Natl Acad Sci U S A. 2003.
Abstract
Interplay among GATA transcription factors is an important determinant of cell fate during hematopoiesis. Although GATA-2 regulates hematopoietic stem cell function, mechanisms controlling GATA-2 expression are undefined. Of particular interest is the repression of GATA-2, because sustained GATA-2 expression in hematopoietic stem and progenitor cells alters hematopoiesis. GATA-2 transcription is derepressed in erythroid precursors lacking GATA-1, but the underlying mechanisms are unknown. Using chromatin immunoprecipitation analysis, we show that GATA-1 binds a highly restricted upstream region of the approximately 70-kb GATA-2 domain, despite >80 GATA sites throughout the domain. GATA-2 also binds this region in the absence of GATA-1. Genetic complementation studies in GATA-1-null cells showed that GATA-1 rapidly displaces GATA-2, which is coupled to transcriptional repression. GATA-1 also displaces CREB-binding protein (CBP), despite the fact that GATA-1 binds CBP in other contexts. Repression correlates with reduced histone acetylation domain-wide, but not altered methylation of histone H3 at lysine 4. The GATA factor-binding region exhibited cell-type-specific enhancer activity in transient transfection assays. We propose that GATA-1 instigates GATA-2 repression by means of disruption of positive autoregulation, followed by establishment of a domain-wide repressive chromatin structure. Such a mechanism is predicted to be critical for the control of hematopoiesis.
Figures
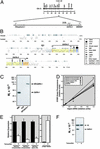
Fig. 1.
GATA-1-dependent repression of transcription from 1S and 1G GATA-2 promoters. (A Upper) Linkage map showing location of murine_GATA-2_ on chromosome 6. (A Lower) Map showing 150 kb surrounding GATA-2 including the 5′ flanking gene_Ribophorin I_ and the putative 3′ flanking gene Q9D9Q7. (B)
pipmaker
(76) alignment of a 77-kb region of the mouse and human GATA-2 domains. Shaded regions indicate the following: promoters, gray; untranslated regions, orange; exons, blue; introns, yellow. HS1 denotes a DNaseI hypersensitive site mapped previously (71). (C) Western blot analysis of GATA-1 and ER-GATA-1 expression with anti-GATA-1 antibody in whole-cell lysates from DMSO-induced MEL cells, G1E, and G1E-ER-GATA cells after a 20-h treatment with 1 μM tamoxifen. (D) SYBR green fluorescence (relative units) was plotted versus the initial G1E input cDNA concentration. The plot illustrates the linearity and range of signals used to measure target cDNA. (E) Quantitative real-time RT-PCR analysis of_GATA-2_ mRNA expression in untreated and tamoxifen-treated (48 h) G1E-ER-GATA cells. Primers amplified transcripts transcribed from the 1S promoter, the 1G promoter, and from both promoters (exon 3/4). β-Globin expression was measured as a control. Relative expression levels were normalized by GAPDH expression (mean ± SEM; five independent experiments). (F) Western blot analysis of GATA-2 expression in untreated and tamoxifen-treated (24 h) G1E-ER-GATA cells. The asterisk denotes a broadly expressed crossreactive band.
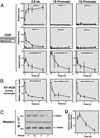
Fig. 4.
Rapid GATA-1-dependent displacement of GATA-2 from the –2.8-kb site. G1E-ER-GATA-1 cells were incubated for 0, 0.5, 2, 4, or 10 h with 1 μM tamoxifen. (A) Quantitative ChIP analysis was used to measure the binding of GATA-1 and -2, as well as H3 acetylation at the –2.8-kb site and at the 1S and 1G promoters. Samples were analyzed quantitatively relative to a standard curve generated from input chromatin. The plots depict relative levels of binding and acetylation (means from four independent experiments). (B) RT-PCR was used to measure primary GATA-2 transcripts arising from use of the 1S promoter (Exon1S/Intron1S), the 1G promoter (Exon1G/Intron2), or both promoters (Intron2/Exon2). GAPDH mRNA was measured as a control. Relative GATA-2 primary transcript levels were normalized by the levels of GAPDH transcripts. The plots depict the mean GATA-2/GAPDH ratios from four independent experiments. (C) Time course for GATA-1-dependent reduction in GATA-2 protein levels. Whole-cell lysates isolated from the same samples as those analyzed by ChIP and RT-PCR were subjected to Western blot analysis. A representative Western blot of GATA-2 and α-tubulin is shown. (D) GATA-2 and α-tubulin levels were quantitated by means of densitometric analysis. The plot depicts GATA-2/α-tubulin ratios at various times after tamoxifen treatment. Note that GATA-2 protein levels are not reduced upon 30 min of tamoxifen treatment, despite GATA-1 binding, GATA-2 displacement, and reduced primary transcripts.
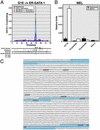
Fig. 2.
Highly selective discrimination by GATA-1 among GATA sites of the_GATA-2_ domain. (A) Quantitative ChIP analysis of G1E-ER-GATA-1 binding within the GATA-2 domain in tamoxifen-treated G1E and untreated and tamoxifen-treated ER-GATA cells. The graph depicts data from at least three independent experiments (mean ± SEM). The diagram below the graph shows the murine GATA-2 domain. Vertical lines below the locus indicate the position of the amplicons analyzed. The distribution of individual and double (two sites within 25 bp) consensus GATA-1 sites is also indicated. The consensus motif is defined on the left. (B) ChIP analysis of ER-GATA-1 binding to the GATA-2 domain of MEL cells treated with 1.5% DMSO for 4 days. Note that the strong binding 2.8 kb upstream of the 1S exon (–2.8 1S) corresponds to the peak of binding in_A_. (mean ± SEM; four independent experiments). (C)GATA-2 domain sequence containing the region bound by GATA-1. The blue shaded sequences represent three amplicons analyzed in A. The middle sequence represents the amplicon in which high-level GATA-1 binding was detected. GATA consensus sites are indicated in bold and italics and are underlined. Note that a double GATA site resides within the amplicon.
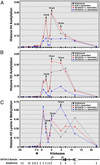
Fig. 3.
GATA-1-dependent remodeling of the histone modification pattern of the_GATA-2_ domain. Quantitative ChIP analysis of H4 (A) and H3 (B) acetylation and H3-meK4 (C) at the murine_GATA-2_ domain. The relative levels of acetylated H3 and H4 and H3-meK4 were plotted as a function of the position within the locus (mean ± SEM; at least three independent experiments). SEM values did not exceed 25% of the corresponding means. Positions of the –2.8-kb region and the 1S and 1G promoters are indicated by arrows. The diagram at the bottom depicts the murine GATA-2 domain and the amplicons analyzed by ChIP.*, the position of the x axis in which the scale changes.
Fig. 5.
GATA-1-dependent displacement of CBP from the –2.8-kb region and from a downstream site. G1E-ER-GATA-1 cells were treated with 1 μM tamoxifen for 20 h. CBP binding to selected sites of the GATA-2 locus and to HS3 of the β-globin locus control region was measured by quantitative ChIP analysis (mean ± SEM; two independent experiments).
Fig. 6.
Regulation of the GATA-2 domain. The models depict the regulation of GATA-2 transcription during hematopoiesis. BMP-4 signals activate_GATA-2_ at the earliest stages of hematopoiesis (33, 35). The analysis described herein shows that GATA-2 binds the –2.8-kb site when the locus is transcriptionally active. BMP-4-dependent activation of GATA-2 would yield a sufficient concentration of GATA-2 to bind the –2.8-kb site and to positively autoregulate GATA-2 expression. As GATA-1 levels increase, GATA-1 would competitively displace GATA-2, disrupting positive autoregulation. GATA-2 displacement is accompanied by loss of CBP from the –2.8-kb site and from a downstream –1.8-kb site. GATA-1 also establishes a repressive chromatin structure by means of broad chromatin modification, but GATA-1-dependent hypoacetylation is delayed temporally relative to repression. It is hypothesized that hypoacetylation locks the locus in an inaccessible state once repression has been instigated via the GATA switch.
Similar articles
- Hematopoietic-specific activators establish an overlapping pattern of histone acetylation and methylation within a mammalian chromatin domain.
Kiekhaefer CM, Grass JA, Johnson KD, Boyer ME, Bresnick EH. Kiekhaefer CM, et al. Proc Natl Acad Sci U S A. 2002 Oct 29;99(22):14309-14. doi: 10.1073/pnas.212389499. Epub 2002 Oct 11. Proc Natl Acad Sci U S A. 2002. PMID: 12379744 Free PMC article. - Distinct functions of dispersed GATA factor complexes at an endogenous gene locus.
Grass JA, Jing H, Kim SI, Martowicz ML, Pal S, Blobel GA, Bresnick EH. Grass JA, et al. Mol Cell Biol. 2006 Oct;26(19):7056-67. doi: 10.1128/MCB.01033-06. Mol Cell Biol. 2006. PMID: 16980610 Free PMC article. - Globin gene activation during haemopoiesis is driven by protein complexes nucleated by GATA-1 and GATA-2.
Anguita E, Hughes J, Heyworth C, Blobel GA, Wood WG, Higgs DR. Anguita E, et al. EMBO J. 2004 Jul 21;23(14):2841-52. doi: 10.1038/sj.emboj.7600274. Epub 2004 Jun 24. EMBO J. 2004. PMID: 15215894 Free PMC article. - Gene expression regulation and domain function of hematopoietic GATA factors.
Shimizu R, Yamamoto M. Shimizu R, et al. Semin Cell Dev Biol. 2005 Feb;16(1):129-36. doi: 10.1016/j.semcdb.2004.11.001. Epub 2004 Dec 10. Semin Cell Dev Biol. 2005. PMID: 15659347 Review. - Developmental control via GATA factor interplay at chromatin domains.
Bresnick EH, Martowicz ML, Pal S, Johnson KD. Bresnick EH, et al. J Cell Physiol. 2005 Oct;205(1):1-9. doi: 10.1002/jcp.20393. J Cell Physiol. 2005. PMID: 15887235 Review.
Cited by
- The contribution of silencer variants to human diseases.
Huang D, Ovcharenko I. Huang D, et al. Genome Biol. 2024 Jul 8;25(1):184. doi: 10.1186/s13059-024-03328-1. Genome Biol. 2024. PMID: 38978133 Free PMC article. - Endogenous small molecule effectors in GATA transcription factor mechanisms governing biological and pathological processes.
Liao R, Bresnick EH. Liao R, et al. Exp Hematol. 2024 Sep;137:104252. doi: 10.1016/j.exphem.2024.104252. Epub 2024 Jun 12. Exp Hematol. 2024. PMID: 38876253 Review. - Transcription factor interactions explain the context-dependent activity of CRX binding sites.
Loell KJ, Friedman RZ, Myers CA, Corbo JC, Cohen BA, White MA. Loell KJ, et al. PLoS Comput Biol. 2024 Jan 16;20(1):e1011802. doi: 10.1371/journal.pcbi.1011802. eCollection 2024 Jan. PLoS Comput Biol. 2024. PMID: 38227575 Free PMC article. - The role of GATA2 in adult hematopoiesis and cell fate determination.
Peters IJA, de Pater E, Zhang W. Peters IJA, et al. Front Cell Dev Biol. 2023 Nov 14;11:1250827. doi: 10.3389/fcell.2023.1250827. eCollection 2023. Front Cell Dev Biol. 2023. PMID: 38033856 Free PMC article. Review. - Linking GATA2 to myeloid dysplasia and complex cytogenetics in adult myelodysplastic neoplasm and acute myeloid leukemia.
Robbins DJ, Pavletich TS, Patil AT, Pahopos D, Lasarev M, Polaki US, Gahvari ZJ, Bresnick EH, Matson DR. Robbins DJ, et al. Blood Adv. 2024 Jan 9;8(1):80-92. doi: 10.1182/bloodadvances.2023011554. Blood Adv. 2024. PMID: 38029365 Free PMC article.
References
- Weiss, M. J. & Orkin, S. H. (1995) Exp. Hematol. 23, 99–107. - PubMed
- Molkentin, J. D. (2000) J. Biol. Chem. 275, 38949–38952. - PubMed
- Patient, R. K. & McGhee, J. D. (2002) Curr. Opin. Genet. Dev. 12, 416–422. - PubMed
- Tsai, S. F., Martin, D. I., Zon, L. I., D'Andrea, A. D., Wong, G. G. & Orkin, S. H. (1989) Nature 339, 446–451. - PubMed
- Tsai, F. Y., Keller, G., Kuo, F. C., Weiss, M., Chen, J., Rosenblatt, M., Alt, F. W. & Orkin, S. H. (1994) Nature 371, 221–226. - PubMed
Publication types
MeSH terms
Substances
LinkOut - more resources
Full Text Sources


