Increased T cell reactivity to amyloid beta protein in older humans and patients with Alzheimer disease - PubMed (original) (raw)
Increased T cell reactivity to amyloid beta protein in older humans and patients with Alzheimer disease
Alon Monsonego et al. J Clin Invest. 2003 Aug.
Abstract
Alzheimer disease (AD) is characterized by the progressive deposition of the 42-residue amyloid beta protein (Abeta) in brain regions serving memory and cognition. In animal models of AD, immunization with Abeta results in the clearance of Abeta deposits from the brain. However, a trial of vaccination with synthetic human Abeta1-42 in AD resulted in the development of meningoencephalitis in some patients. We measured cellular immune responses to Abeta in middle-aged and elderly healthy subjects and in patients with AD. A significantly higher proportion of healthy elderly subjects and patients with AD had strong Abeta-reactive T cell responses than occurred in middle-aged adults. The immunodominant Abeta epitopes in humans resided in amino acids 16-33. Epitope mapping enabled the identification of MHC/T cell receptor (TCR) contact residues. The occurrence of intrinsic T cell reactivity to the self-antigen Abeta in humans has implications for the design of Abeta vaccines, may itself be linked to AD susceptibility and course, and appears to be associated with the aging process.
Figures
Figure 1
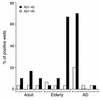
Aβ1–42 is more immunogenic than Aβ1–40. PBMCs were isolated from nine subjects (three adults, three older healthy subjects, and three patients with clinically mild or moderate AD) and cultured in U-bottom 96-well plates in the presence of human Aβ1–40 or Aβ1–42 (30 wells per peptide) as described in Methods. Cells were then restimulated at day 10 in the presence or absence of the peptide used initially. T cell proliferation was measured by [3H]thymidine incorporation 72 hours after the secondary stimulation. The percentage of positive wells was obtained according to the number of wells (out of 30) with SIs (cpm in the presence of antigen divided by cpm in the absence of antigen) of at least 2.5 and a Δcpm of at least 2,000.
Figure 2
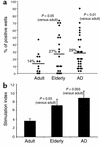
Aβ T cell reactivity is increased in elderly subjects and patients with AD. PBMCs were isolated from adult and elderly healthy subjects and patients with AD as described in Methods. Aβ-induced proliferation was measured after secondary stimulation in the split-well assay. (a) Percentage of positive wells was calculated for each individual as in Figure 1. (b) Average SIs ± SEM were calculated for each group on the basis of the average SIs for each individual (sum of positive SIs [each at least 2.5 with a Δcpm of > 2,000] divided by the number of positive wells). Two-tailed P values were calculated using the alternate Welch t test, assuming Gaussian populations with unequal SDs.
Figure 3
Epitope specificity and cytokine profile of Aβ-reactive T cell lines. Split-well assays were performed as described in Methods. To generate Aβ-reactive T cell lines, positive wells were restimulated in the presence of irradiated PBMCs and Aβ and then maintained with 10 U/ml IL-2. To determine Aβ and epitope specificity, T cell lines were stimulated with Aβ1–42 and two overlapping peptides, Aβ1–28 or Aβ15–42, followed by their stimulation with nested peptides of the Aβ15–42 region. To measure Aβ-induced cytokine production, supernatants were collected 48 hours after stimulation and examined by ELISA. T cell proliferation of three representative lines is shown: (a–c) induced by Aβ1–42 (a and c) Aβ15–42, and (b) Aβ1–28. T cell proliferation was also induced by (d) Aβ16–30 (e) Aβ19–33, and (f) Aβ28–42. Aβ-induced secretion of IFN-γ and IL-13 is shown in g through l.
Figure 4
Activated Aβ-reactive T cells exhibit Th1, Th2, and Th0 phenotypes after stimulation with autologous PBMCs and Aβ peptides. Aβ-reactive T cells were established from a secondary stimulation assay as described in Methods. Resting cells were cultured with autologous PBMCs alone or stimulated in the presence of Aβ1–42, Aβ15–42, or Aβ1–28 and harvested after 30 hours. Cells were stained with Cy-chrome–labeled anti-CD4 and FITC-labeled anti-CD69 (a) followed by intracellular staining with phycoerythrin-labeled anti–IFN-γ, –IL-13, –IL-5, –IL-10, and –IL-12 (b). Cells also were stained with Cy-chrome–labeled anti-CD4 followed by intracellular staining with FITC-labeled anti–IFN-γ and phycoerythrin-labeled anti–IL-13 or anti–IL-5 (c). Positive cells were not observed when intracellular staining was performed with isotype controls (data not shown). For (b) and (c), analysis was gated on CD4+ cells. No Ag., no antigen.
Comment in
- Amyloid beta and Alzheimer disease therapeutics: the devil may be in the details.
Cirrito JR, Holtzman DM. Cirrito JR, et al. J Clin Invest. 2003 Aug;112(3):321-3. doi: 10.1172/JCI19420. J Clin Invest. 2003. PMID: 12897198 Free PMC article.
Similar articles
- Strikingly reduced amyloid burden and improved behavioral performance in Alzheimer's disease mice immunized with recombinant chimeric vaccines by hexavalent foldable Aβ₁₋₁₅ fused to toxin-derived carrier proteins.
Yu YZ, Wang WB, Chen A, Chang Q, Liu S, Zhao M, Wang S, Qiu WY, Pang XB, Xu Q, Sun ZW. Yu YZ, et al. J Alzheimers Dis. 2014;41(1):243-60. doi: 10.3233/JAD-132177. J Alzheimers Dis. 2014. PMID: 24625800 - Prototype Alzheimer's disease vaccine using the immunodominant B cell epitope from beta-amyloid and promiscuous T cell epitope pan HLA DR-binding peptide.
Agadjanyan MG, Ghochikyan A, Petrushina I, Vasilevko V, Movsesyan N, Mkrtichyan M, Saing T, Cribbs DH. Agadjanyan MG, et al. J Immunol. 2005 Feb 1;174(3):1580-6. doi: 10.4049/jimmunol.174.3.1580. J Immunol. 2005. PMID: 15661919 - Enhancing Th2 immune responses against amyloid protein by a DNA prime-adenovirus boost regimen for Alzheimer's disease.
Kim HD, Jin JJ, Maxwell JA, Fukuchi K. Kim HD, et al. Immunol Lett. 2007 Sep 15;112(1):30-8. doi: 10.1016/j.imlet.2007.06.006. Epub 2007 Jul 23. Immunol Lett. 2007. PMID: 17686533 Free PMC article. - Amyloid-beta immunotherapy for the prevention and treatment of Alzheimer disease: lessons from mice, monkeys, and humans.
Lemere CA, Maier M, Jiang L, Peng Y, Seabrook TJ. Lemere CA, et al. Rejuvenation Res. 2006 Spring;9(1):77-84. doi: 10.1089/rej.2006.9.77. Rejuvenation Res. 2006. PMID: 16608400 Review. - Immunotherapy for Alzheimer's disease: from anti-β-amyloid to tau-based immunization strategies.
Panza F, Frisardi V, Solfrizzi V, Imbimbo BP, Logroscino G, Santamato A, Greco A, Seripa D, Pilotto A. Panza F, et al. Immunotherapy. 2012 Feb;4(2):213-38. doi: 10.2217/imt.11.170. Immunotherapy. 2012. PMID: 22339463 Review.
Cited by
- β-Amyloids and Immune Responses Associated with Alzheimer's Disease.
Kolobova E, Petrushanko I, Mitkevich V, Makarov AA, Grigorova IL. Kolobova E, et al. Cells. 2024 Sep 28;13(19):1624. doi: 10.3390/cells13191624. Cells. 2024. PMID: 39404388 Free PMC article. Review. - CD8+ T cells exacerbate AD-like symptoms in mouse model of amyloidosis.
Wang X, Campbell B, Bodogai M, McDevitt RA, Patrikeev A, Gusev F, Ragonnaud E, Kumaraswami K, Shirenova S, Vardy K, Alameh MG, Weissman D, Ishikawa-Ankerhold H, Okun E, Rogaev E, Biragyn A. Wang X, et al. Brain Behav Immun. 2024 Nov;122:444-455. doi: 10.1016/j.bbi.2024.08.045. Epub 2024 Aug 25. Brain Behav Immun. 2024. PMID: 39191349 - The roles of AIM2 in neurodegenerative diseases: insights and therapeutic implications.
Yang K, Wang X, Pan H, Wang X, Hu Y, Yao Y, Zhao X, Sun T. Yang K, et al. Front Immunol. 2024 Jul 15;15:1441385. doi: 10.3389/fimmu.2024.1441385. eCollection 2024. Front Immunol. 2024. PMID: 39076969 Free PMC article. Review. - Neuroinflammation in Alzheimer's disease: insights from peripheral immune cells.
Zhang Q, Yang G, Luo Y, Jiang L, Chi H, Tian G. Zhang Q, et al. Immun Ageing. 2024 Jun 14;21(1):38. doi: 10.1186/s12979-024-00445-0. Immun Ageing. 2024. PMID: 38877498 Free PMC article. Review. - CD4+ T-Cell Senescence in Neurodegenerative Disease: Pathogenesis and Potential Therapeutic Targets.
Gao Y, Lu Y, Liang X, Zhao M, Yu X, Fu H, Yang W. Gao Y, et al. Cells. 2024 Apr 25;13(9):749. doi: 10.3390/cells13090749. Cells. 2024. PMID: 38727285 Free PMC article. Review.
References
- Price DL, Sisodia SS. Mutant genes in familial Alzheimer’s disease and transgenic models. Annu. Rev. Neurosci. 1998;21:479–505. - PubMed
- Selkoe DJ. Alzheimer’s disease: genes, proteins, and therapy. Physiol. Rev. 2001;81:741–766. - PubMed
- Jarrett JT, Lansbury PT., Jr Seeding “one-dimensional crystallization” of amyloid: a pathogenic mechanism in Alzheimer’s disease and scrapie? Cell. 1993;73:1055–1058. - PubMed
- McGeer EG, McGeer PL. The importance of inflammatory mechanisms in Alzheimer disease. Exp. Gerontol. 1998;33:371–378. - PubMed
Publication types
MeSH terms
Substances
LinkOut - more resources
Full Text Sources
Other Literature Sources
Medical
Molecular Biology Databases
Research Materials


