The mitochondrial genome of Chara vulgaris: insights into the mitochondrial DNA architecture of the last common ancestor of green algae and land plants - PubMed (original) (raw)
Comparative Study
. 2003 Aug;15(8):1888-903.
doi: 10.1105/tpc.013169.
Affiliations
- PMID: 12897260
- PMCID: PMC167177
- DOI: 10.1105/tpc.013169
Comparative Study
The mitochondrial genome of Chara vulgaris: insights into the mitochondrial DNA architecture of the last common ancestor of green algae and land plants
Monique Turmel et al. Plant Cell. 2003 Aug.
Abstract
Mitochondrial DNA (mtDNA) has undergone radical changes during the evolution of green plants, yet little is known about the dynamics of mtDNA evolution in this phylum. Land plant mtDNAs differ from the few green algal mtDNAs that have been analyzed to date by their expanded size, long spacers, and diversity of introns. We have determined the mtDNA sequence of Chara vulgaris (Charophyceae), a green alga belonging to the charophycean order (Charales) that is thought to be the most closely related alga to land plants. This 67,737-bp mtDNA sequence, displaying 68 conserved genes and 27 introns, was compared with those of three angiosperms, the bryophyte Marchantia polymorpha, the charophycean alga Chaetosphaeridium globosum (Coleochaetales), and the green alga Mesostigma viride. Despite important differences in size and intron composition, Chara mtDNA strikingly resembles Marchantia mtDNA; for instance, all except 9 of 68 conserved genes lie within blocks of colinear sequences. Overall, our genome comparisons and phylogenetic analyses provide unequivocal support for a sister-group relationship between the Charales and the land plants. Only four introns in land plant mtDNAs appear to have been inherited vertically from a charalean algar ancestor. We infer that the common ancestor of green algae and land plants harbored a tightly packed, gene-rich, and relatively intron-poor mitochondrial genome. The group II introns in this ancestral genome appear to have spread to new mtDNA sites during the evolution of bryophytes and charalean green algae, accounting for part of the intron diversity found in Chara and land plant mitochondria.
Figures
Figure 1.
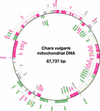
Gene Map of Chara mtDNA. Genes (closed boxes) shown on the outside of the map are transcribed in a clockwise direction, whereas those shown on the inside of the map are transcribed counterclockwise. Genes absent from Marchantia mtDNA are represented in beige. Gene clusters shared with Marchantia mtDNA are shown as alternating series of green and red boxes. Genes present in Marchantia mtDNA but located outside conserved clusters are shown in gray. tRNA genes are indicated by the one-letter amino acid code (Me, elongator methionine; Mf, initiator methionine) followed by the anticodon in parentheses. A total of 27 introns (open boxes) were identified, some of which feature ORFs (narrow boxes).
Figure 2.
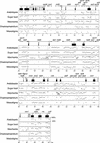
MultiPipMaker Analysis of mtDNAs from Chara, Other Streptophytes, and Mesostigma. The reference genome, Chara mtDNA, was aligned against five other green plant mtDNAs. At the top of the alignment, genes and their polarities are denoted by horizontal arrows, and exons are represented by closed boxes. Positions on the Chara genome are given at the bottom of the alignment. Homologies between aligned regions are shown as average percentage identity between 50 and 100% (the scale is shown at the end of the Arabidopsis plot).
Figure 3.
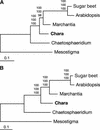
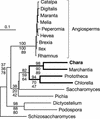
Phylogenetic Position of Chara as Inferred from Complete Mitochondrial Genome Sequences of Green Plants. (A) Phylogenetic analysis of a concatenated data set of 23 mitochondrial proteins. The best maximum likelihood tree computed with CODEML using a Γ-distributed rate of substitutions across sites is shown. Bootstrap values obtained in maximum likelihood, distance, and maximum parsimony analyses are indicated above the nodes in the top, middle, and bottom positions, respectively. Bootstrapping in both the maximum likelihood and distance analyses was performed using a Γ-distributed rate of substitutions across sites. (B) Phylogenetic analysis of a concatenated data set of 23 genes. This nucleotide data set corresponds to the protein data set. The best maximum likelihood tree is shown. Bootstrap values obtained in maximum likelihood, distance, and maximum parsimony analyses are indicated above the nodes in the top, middle, and bottom positions, respectively.
Figure 4.
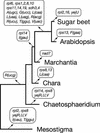
Phylogenetic Distribution of Mitochondrial Gene Losses in the Streptophyta. Events of gene loss inferred from the mitochondrial genome sequences of six green plants were mapped on the tree shown in Figure 3A. A repertoire of 72 genes was predicted for the mitochondrial genome of the green algal ancestor of Mesostigma and the five streptophytes examined. This repertoire includes rps8, rps13, trnL(caa), and trnR(ucg) in addition to the genes found in Chara mtDNA (Table 2). In the lineage leading to angiosperms, the tRNA genes that were lost after the insertion of homologous chloroplast DNA sequences are not indicated. Note also that intron-encoded genes were not considered in our analysis and that there is evidence that the sdh and all rps genes, except rps2 and rps11, were lost independently in the sugar beet and Arabidopsis lineages (Adams et al., 2002).
Figure 5.
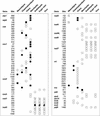
Distribution of Introns in Streptophyte and Mesostigma mtDNAs. Circles denote the presence of a group-I intron, and squares denote the presence of a group-II intron. Divided squares represent _trans_-spliced group-II introns. Open symbols denote the absence of an ORF, and closed symbols denote its presence. For protein-coding and tRNA genes, insertion sites are given relative to the corresponding genes in Reclinomonas americana; for rRNA genes, they are given relative to the corresponding genes in Escherichia coli. For each site, the position corresponding to the nucleotide immediately preceding the intron is reported. The anticodons of trnG, trnN, and trnS are ucc, guu, and gcu, respectively.
Figure 6.
Phylogenetic Relationships between Chara cox1.i2 and Homologous Introns Inserted at the Same Site in the cox1 Gene. A data set of intron sequences originating from site 732 of the cox1 gene (177 sites corresponding to unambiguously aligned regions of the intron core) was analyzed using distance, maximum parsimony, and maximum likelihood methods. The distance and maximum likelihood analyses were performed using the Hasegawa-Kishino-Yano model and a uniform rate of substitutions across sites. The unrooted majority-rule distance tree is shown. Bootstrap values obtained in distance, maximum parsimony, and maximum likelihood analyses after 100 replications are indicated above selected nodes in the top, middle, and bottom positions, respectively. The clade containing introns from Chara, Marchantia, and two chlorophytes is highlighted with thick lines.
Figure 7.
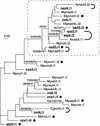
Phylogenetic Analysis of Group-IIA Mitochondrial Introns from Chara and Marchantia and of Selected Introns from Chaetosphaeridium and Arabidopsis. All Chara and Marchantia introns that were identified as belonging to group IIA were analyzed, whereas only those of Chaetosphaeridium and Arabidopsis that share insertion sites with their Chara counterparts were examined. Introns originating from Chara are indicated in boldface; Marchantia, Chaetosphaeridium, and Arabidopsis introns are distinguished by the prefixes Mp, Cg, and At, respectively. The introns whose names are followed by closed circles contain ORFs. The introns that are connected by thick, curved lines share common insertion sites. The nucleotide data set (122 sites corresponding to unambiguously aligned regions of the intron core) was analyzed using distance, maximum parsimony, and maximum likelihood methods. The distance and maximum likelihood analyses were performed using the Hasegawa-Kishino-Yano model and a uniform rate of substitutions across sites. The unrooted maximum likelihood tree is shown. Bootstrap values obtained in distance, maximum parsimony, and maximum likelihood analyses after 100 replications are indicated above the nodes in the top, middle, and bottom positions, respectively; only values of >50% are shown. A highly supported clade containing 13 introns is framed.
Figure 8.
Compared Secondary Structure Models of the Chara and Marchantia nad3 Introns. Exon sequences are shown in lowercase letters. Roman numerals specify the major structural domains of the introns, and uppercase letters followed by numbers denote the helices in domain I. Dashed lines, curved arrows, and/or Greek letters represent tertiary interactions. EBS and IBS indicate exon binding and intron binding sites, respectively. Nucleotides that potentially participate in the δ–δ′ interaction are boxed. Positions exhibiting different nucleotides are denoted by dots. Positions showing deletions/additions are denoted by arrows labeled with two numbers separated by a dash; the first number indicates the number of nucleotides inserted in the Chara sequence. Conserved base pairings are represented by dashes. The numbers inside the variable loops indicate the sizes of these loops in the compared introns, with the top number denoting the size of the Chara sequence.
Similar articles
- An unexpectedly large and loosely packed mitochondrial genome in the charophycean green alga Chlorokybus atmophyticus.
Turmel M, Otis C, Lemieux C. Turmel M, et al. BMC Genomics. 2007 May 30;8:137. doi: 10.1186/1471-2164-8-137. BMC Genomics. 2007. PMID: 17537252 Free PMC article. - Green algae and the evolution of land plants: inferences from nuclear-encoded rRNA gene sequences.
Chapman RL, Buchheim MA. Chapman RL, et al. Biosystems. 1992;28(1-3):127-37. doi: 10.1016/0303-2647(92)90015-q. Biosystems. 1992. PMID: 1292658 Review. - The mitochondrial DNA of land plants: peculiarities in phylogenetic perspective.
Knoop V. Knoop V. Curr Genet. 2004 Sep;46(3):123-39. doi: 10.1007/s00294-004-0522-8. Epub 2004 Aug 6. Curr Genet. 2004. PMID: 15300404 Review.
Cited by
- Evolution of DNA amounts across land plants (embryophyta).
Leitch IJ, Soltis DE, Soltis PS, Bennett MD. Leitch IJ, et al. Ann Bot. 2005 Jan;95(1):207-17. doi: 10.1093/aob/mci014. Ann Bot. 2005. PMID: 15596468 Free PMC article. - A trans-splicing group I intron and tRNA-hyperediting in the mitochondrial genome of the lycophyte Isoetes engelmannii.
Grewe F, Viehoever P, Weisshaar B, Knoop V. Grewe F, et al. Nucleic Acids Res. 2009 Aug;37(15):5093-104. doi: 10.1093/nar/gkp532. Epub 2009 Jun 23. Nucleic Acids Res. 2009. PMID: 19553190 Free PMC article. - Mitochondrial mRNA Processing in the Chlorophyte Alga Pediastrum duplex and Streptophyte Alga Chara vulgaris Reveals an Evolutionary Branch in Mitochondrial mRNA Processing.
Proulex GCR, Meade MJ, Manoylov KM, Cahoon AB. Proulex GCR, et al. Plants (Basel). 2021 Mar 18;10(3):576. doi: 10.3390/plants10030576. Plants (Basel). 2021. PMID: 33803683 Free PMC article. - An unexpectedly large and loosely packed mitochondrial genome in the charophycean green alga Chlorokybus atmophyticus.
Turmel M, Otis C, Lemieux C. Turmel M, et al. BMC Genomics. 2007 May 30;8:137. doi: 10.1186/1471-2164-8-137. BMC Genomics. 2007. PMID: 17537252 Free PMC article. - Metabolomics of a single vacuole reveals metabolic dynamism in an alga Chara australis.
Oikawa A, Matsuda F, Kikuyama M, Mimura T, Saito K. Oikawa A, et al. Plant Physiol. 2011 Oct;157(2):544-51. doi: 10.1104/pp.111.183772. Epub 2011 Aug 16. Plant Physiol. 2011. PMID: 21846815 Free PMC article.
References
- Adachi, J., and Hasegawa, M. (1996). MOLPHY version 2.3: Programs for molecular phylogenetics based on maximum likelihood method. Comput. Sci. Monogr. 28, 1–150.
- Altschul, S.F., Gish, W., Miller, W., Myers, E.W., and Lipman, D.J. (1990). Basic local alignment search tool. J. Mol. Biol. 215, 403–410. - PubMed
- Beckert, S., Muhle, H., Pruchner, D., and Knoop, V. (2001). The mitochondrial nad2 gene as a novel marker locus for phylogenetic analysis of early land plants: A comparative analysis in mosses. Mol. Phylogenet. Evol. 18, 117–126. - PubMed
- Beckert, S., Steinhauser, S., Muhle, H., and Knoop, V. (1999). A molecular phylogeny of bryophytes based on nucleotide sequences of the mitochondrial nad5 gene. Plant Syst. Evol. 218, 179–192.
Publication types
MeSH terms
Substances
LinkOut - more resources
Full Text Sources
Molecular Biology Databases
