Frataxin deficiency in pancreatic islets causes diabetes due to loss of beta cell mass - PubMed (original) (raw)
. 2003 Aug;112(4):527-34.
doi: 10.1172/JCI18107.
Hindrik Mulder, Doreen Pomplun, Tim J Schulz, Katrin Müller-Schmehl, Anja Krause, Malin Fex, Helene Puccio, Jörg Müller, Frank Isken, Joachim Spranger, Dirk Müller-Wieland, Mark A Magnuson, Matthias Möhlig, Michel Koenig, Andreas F H Pfeiffer
Affiliations
- PMID: 12925693
- PMCID: PMC171391
- DOI: 10.1172/JCI18107
Frataxin deficiency in pancreatic islets causes diabetes due to loss of beta cell mass
Michael Ristow et al. J Clin Invest. 2003 Aug.
Abstract
Diabetes is caused by an absolute (type 1) or relative (type 2) deficiency of insulin-producing beta cells. We have disrupted expression of the mitochondrial protein frataxin selectively in pancreatic beta cells. Mice were born healthy but subsequently developed impaired glucose tolerance progressing to overt diabetes mellitus. These observations were explained by impairment of insulin secretion due to a loss of beta cell mass in knockout animals. This phenotype was preceded by elevated levels of reactive oxygen species in knockout islets, an increased frequency of apoptosis, and a decreased number of proliferating beta cells. Hence, disruption of the frataxin gene in pancreatic beta cells causes diabetes following cellular growth arrest and apoptosis, paralleled by an increase in reactive oxygen species in islets. These observations might provide insight into the deterioration of beta cell function observed in different subtypes of diabetes in humans.
Figures
Figure 1
Tissue-specific knockout of the frataxin gene in pancreatic β cells. (a) A genomic PCR derived from primers located up- and downstream of the putatively knocked-out exon 4 of the frataxin gene. DNA was isolated from indicated tissue from one 4-week-old lox control animal (first lane of each triplet) and two 4-week-old knockout animals (second and third lanes of each triplet). DNA from a whole-body knockout (Gen KO) was used as a positive control (9). (b) A reversely transcribed PCR using RNA from the same animals as in a, using primers located in exons 3 and 5 of the murine frataxin cDNA. (c) Subsets of microphotographs (original magnification, ×200) of immunohistochemistry against murine frataxin on islets from 4-week-old animals of the indicated genotype. (d) Microphotographs (original magnification, ×200) of one representative knockout islet immunohistochemically stained for glucagon (green, left) and frataxin (red, middle). Overlay of both microphotographs indicates colocalization of the remaining frataxin signals in knockout islets with glucagon-positive cells.
Figure 2
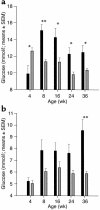
Diabetes develops progressively in β cell–specific frataxin knockout animals. (a) Blood glucose concentrations in knockout animals (indicated by black bars) and control animals (comprising wild-type, heterozygous Ins2-cre, and homozygous loxP genotypes; indicated by gray bars) after overnight ad libitum supply of standard chow (random-fed). (b) Blood glucose concentrations after an overnight fast. Error bars depict SEM. *0.05 > P > 0.005; **P < 0.005.
Figure 3
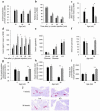
Diabetes develops because of decreased insulin secretion caused by a progressive reduction in β cell mass. (a) β-hydroxybutyrate levels in knockout animals at different ages. (b) Results of an insulin-tolerance test at an age of 18 weeks. (c) Blood glucose levels 2 hours after intraperitoneal (i.p.) injection of glucose. (d) Insulin levels after intraperitoneal injection of glucose in 18-week-old mice. (e) Static incubations of isolated islets from 6-week-old animals in 35 mM potassium chloride and different concentrations of glucose (as indicated). (f) Number of islets isolated by collagenase digestion from pancreata of mice at different ages. (g) Number of insulin-positive areas on all pancreatic sections per pancreas from mice at different ages. (h) Ratios of total insulin-positive area in pancreata from mice at different ages per whole pancreatic area. (i) Average size per insulin-positive area from mice at different ages. Black bars, knockout animals; gray bars, control animals. (j) Subsets of microphotographs (original magnification, ×40) from mice evaluated in g, using an anti-insulin antibody. Error bars depict SEM. *0.05 > P > 0.005; **P < 0.005.
Figure 4
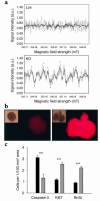
Increased levels of ROS, increased apoptosis, and decreased proliferation precede reduction of β cell mass. (a) Readouts from ESR-based detection of superoxide in control islets (upper panel) and knockout islets (lower panel) from 6-week-old animals. Gray lines depict the raw signal with magnetic fields, and black lines depict the filtered signal. Circles indicate peaks and troughs used to determine the type of ROS, in this case specifically indicating the presence of superoxide. a.u., arbitrary units. (b) Fluorescence at 488 nm after loading of islets with H2DCF, showing higher levels of DCF, an oxidation product of H2DCF, in knockout islets in the presence of 11.1 mM glucose. Insets depict native islets. (c) Quantification of islet cells immunohistochemically positive for activated caspase-3, a marker of apoptosis, as well as Ki67 and BrdU, both markers for proliferation. Black bars, knockout animals; gray bars, control animals; error bars, SEM. **P < 0.005.
Similar articles
- Loss of TFB1M results in mitochondrial dysfunction that leads to impaired insulin secretion and diabetes.
Sharoyko VV, Abels M, Sun J, Nicholas LM, Mollet IG, Stamenkovic JA, Göhring I, Malmgren S, Storm P, Fadista J, Spégel P, Metodiev MD, Larsson NG, Eliasson L, Wierup N, Mulder H. Sharoyko VV, et al. Hum Mol Genet. 2014 Nov 1;23(21):5733-49. doi: 10.1093/hmg/ddu288. Epub 2014 Jun 10. Hum Mol Genet. 2014. PMID: 24916378 - Evidence for a role of frataxin in pancreatic islets isolated from multi-organ donors with and without type 2 diabetes mellitus.
Del Guerra S, D'Aleo V, Gualtierotti G, Pandolfi R, Boggi U, Vistoli F, Barnini S, Filipponi F, Del Prato S, Lupi R. Del Guerra S, et al. Horm Metab Res. 2012 Jun;44(6):471-5. doi: 10.1055/s-0032-1301920. Epub 2012 Mar 7. Horm Metab Res. 2012. PMID: 22399236 - Oxidative stress, beta-cell apoptosis, and decreased insulin secretory capacity in mouse models of hemochromatosis.
Cooksey RC, Jouihan HA, Ajioka RS, Hazel MW, Jones DL, Kushner JP, McClain DA. Cooksey RC, et al. Endocrinology. 2004 Nov;145(11):5305-12. doi: 10.1210/en.2004-0392. Epub 2004 Aug 12. Endocrinology. 2004. PMID: 15308612 - Diabetes, insulin secretion, and the pancreatic beta-cell mitochondrion.
Langin D. Langin D. N Engl J Med. 2001 Dec 13;345(24):1772-4. doi: 10.1056/NEJM200112133452412. N Engl J Med. 2001. PMID: 11742055 Review. No abstract available.
Cited by
- Oxytocin Protects against Stress-Induced Cell Death in Murine Pancreatic β-Cells.
Watanabe S, Wei FY, Matsunaga T, Matsunaga N, Kaitsuka T, Tomizawa K. Watanabe S, et al. Sci Rep. 2016 May 4;6:25185. doi: 10.1038/srep25185. Sci Rep. 2016. PMID: 27143105 Free PMC article. - Understanding the genetic and molecular pathogenesis of Friedreich's ataxia through animal and cellular models.
Martelli A, Napierala M, Puccio H. Martelli A, et al. Dis Model Mech. 2012 Mar;5(2):165-76. doi: 10.1242/dmm.008706. Dis Model Mech. 2012. PMID: 22382366 Free PMC article. Review. - Lymphoblast Oxidative Stress Genes as Potential Biomarkers of Disease Severity and Drug Effect in Friedreich's Ataxia.
Hayashi G, Cortopassi G. Hayashi G, et al. PLoS One. 2016 Apr 14;11(4):e0153574. doi: 10.1371/journal.pone.0153574. eCollection 2016. PLoS One. 2016. PMID: 27078885 Free PMC article. - TORC1 Inhibition by Rapamycin Promotes Antioxidant Defences in a Drosophila Model of Friedreich's Ataxia.
Calap-Quintana P, Soriano S, Llorens JV, Al-Ramahi I, Botas J, Moltó MD, Martínez-Sebastián MJ. Calap-Quintana P, et al. PLoS One. 2015 Jul 9;10(7):e0132376. doi: 10.1371/journal.pone.0132376. eCollection 2015. PLoS One. 2015. PMID: 26158631 Free PMC article. - Oxidative stress in inherited mitochondrial diseases.
Hayashi G, Cortopassi G. Hayashi G, et al. Free Radic Biol Med. 2015 Nov;88(Pt A):10-7. doi: 10.1016/j.freeradbiomed.2015.05.039. Epub 2015 Jun 12. Free Radic Biol Med. 2015. PMID: 26073122 Free PMC article. Review.
References
- Friedreich N. Ueber degenerative Atrophie der spinalen Hinterstränge. Virchows Archiv der Pathologischen Anatomie. 1863;26:391–419.
- McKusick, V.A., et al. 2003. Friedreich ataxia. www.ncbi.nlm.nih.gov/htbin-post/Omim/dispmim?229300.
- Campuzano V, et al. Friedreich’s ataxia: autosomal recessive disease caused by an intronic GAA triplet repeat expansion. Science. 1996;271:1423–1427. - PubMed
- Koutnikova H, et al. Studies of human, mouse and yeast homologues indicate a mitochondrial function for frataxin. Nat. Genet. 1997;16:345–351. - PubMed
- Mühlenhoff U, Richhardt N, Ristow M, Kispal G, Lill R. The yeast frataxin homologue Yfh1p plays a specific role in the maturation of cellular Fe/S proteins. Hum. Mol. Genet. 2002;11:2025–2036. - PubMed
Publication types
MeSH terms
Substances
LinkOut - more resources
Full Text Sources
Other Literature Sources
Medical
Molecular Biology Databases


