Membrane permeability changes at early stages of influenza hemagglutinin-mediated fusion - PubMed (original) (raw)
Membrane permeability changes at early stages of influenza hemagglutinin-mediated fusion
V A Frolov et al. Biophys J. 2003 Sep.
Abstract
While biological membrane fusion is classically defined as the leak-free merger of membranes and contents, leakage is a finding in both experimental and theoretical studies. The fusion stages, if any, that allow membrane permeation are uncharted. In this study we monitored membrane ionic permeability at early stages of fusion mediated by the fusogenic protein influenza hemagglutinin (HA). HAb2 cells, expressing HA on their plasma membrane, fused with human red blood cells, cultured liver cells PLC/PRF/5, or planar phospholipid bilayer membranes. With a probability that depended upon the target membrane, an increase of the electrical conductance of the fusing membranes (leakage) by up to several nS was generally detected. This leakage was recorded at the initial stages of fusion, when fusion pores formed. This leakage usually accompanied the "flickering" stage of the early fusion pore development. As the pore widened, the leakage reduced; concomitantly, the lipid exchange between the fusing membranes accelerated. We conclude that during fusion pore formation, HA locally and temporarily increases the permeability of fusing membranes. Subsequent rearrangement in the fusion complex leads to the resealing of the leaky membranes and enlargement of the pore.
Figures
FIGURE 1
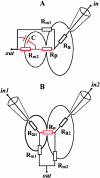
Equivalent electrical circuits of the experimental systems used. (A) HAb2/RBC and HAb2/BLM systems. (B) HAb2/PLC system. _G_dc is measured between points in and out under voltage-clamp conditions. In A, in designates the interior of HAb2 cell for the HAb2/RBC system or trans compartment of the BLM chamber (Melikyan et al., 1995) for the HAb2/BLM system. In B, in1 and in2 designate the interiors of HAb2 and PLC cells. In A and B, out is extracellular medium. Before fusion, circuit consists of membrane resistance (_R_m1 or _R_m2) and access resistance (_R_a1 or _R_a2) (black elements). After fusion, the equivalent circuit combines membrane resistances of both fusion partners and of the fusion pore resistance (_R_p) (red and black elements).
FIGURE 2
Fusion between HAb2 cells and RBC at 33°C. (A) Time-course of admittance changes (Δ_Im_ and Δ_Re_) and _G_dc; zero time corresponds to the pH lowering. The first opening of the fusion pore occurred at ∼26 s. (B) Expanded segment of A illustrating fusion pore flickering. (C) Calculated conductances of fusion pore (_G_p, left y-axis) and fusing membranes (_G_HAb2 and _G_RBC, left y-axis) after the pore stopped flickering (38–72 s from records shown in A). The increase in the integrated fluorescence of the HAb2 membrane (Fl, arbitrary units, right y-axis) corresponds to the transfer of lipid fluorescent dye PKH26 from the RBC membrane to the HAb2 membrane. (D) Calculated conductances of fusion pore (_G_p, left y-axis) and fusing membranes (_G_HAb2 and _G_RBC, left y-axis) during the pore flickering (corresponds to records shown in B). Membrane conductances were calculated only on those parts of the record where the fusion pore was open (Eq. 1a).
FIGURE 3
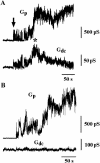
Fusion between HAb2 cells and RBC at 20°C. (A) Transient increase of _G_dc during slow pore enlargement. Arrow points to the pore flickering, and asterisk indicates _G_dc transient increase after the pore flickering. (B) Example of a nonleaky fusion between HAb2 and RBC.
FIGURE 4
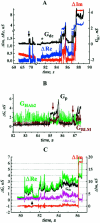
HA-induced changes in BLM conductance during HAb2/BLM fusion. (A) Time-course of admittance changes (Δ_Im_ and Δ_Re_) and _G_dc; zero time corresponds to the pH lowering. Arrow indicates the first opening of the fusion pore. Asterisk indicates change in G_dc without accompanying change in Δ_Im. (B) Calculated conductances of fusion pore (_G_p) and fusing membranes (_G_HAb2 and _G_BLM) after the pore stopped flickering (82–87.5 s from records shown in A). Arrows indicate transient changes in _G_BLM. (C) An example of a record in which change in G_dc was not accompanied by changes in Δ_Im throughout the entire fusion process. Parameters for leakage estimates were sampled at the moment marked by arrow.
FIGURE 5
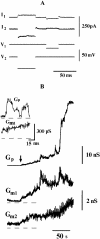
Fusion between HAb2 and PLC cells. (A) Traces illustrating the voltage-pulse protocol (see Materials and Methods). (B) _G_m1 and _G_m2 correspond to the DC conductance of fusing membranes, _G_p to the intercellular conductance; the record begins 90 s after pH application. Insert shows the first opening of the fusion pore (the moment is marked by arrow).
Similar articles
- Kinetically differentiating influenza hemagglutinin fusion and hemifusion machines.
Mittal A, Leikina E, Chernomordik LV, Bentz J. Mittal A, et al. Biophys J. 2003 Sep;85(3):1713-24. doi: 10.1016/S0006-3495(03)74601-3. Biophys J. 2003. PMID: 12944286 Free PMC article. - Hemagglutinin-induced fusion of HAb2 and PLC cells: dynamics of fusion pore conductance.
Dunina-Barkovskaya AYA, Samsonov AV, Pivovarov VS, Frolov VA. Dunina-Barkovskaya AYA, et al. Membr Cell Biol. 2000;13(4):567-80. Membr Cell Biol. 2000. PMID: 10926374 - Influenza hemagglutinin-mediated fusion pores connecting cells to planar membranes: flickering to final expansion.
Melikyan GB, Niles WD, Peeples ME, Cohen FS. Melikyan GB, et al. J Gen Physiol. 1993 Dec;102(6):1131-49. doi: 10.1085/jgp.102.6.1131. J Gen Physiol. 1993. PMID: 8133242 Free PMC article. - Protein-lipid interplay in fusion and fission of biological membranes.
Chernomordik LV, Kozlov MM. Chernomordik LV, et al. Annu Rev Biochem. 2003;72:175-207. doi: 10.1146/annurev.biochem.72.121801.161504. Annu Rev Biochem. 2003. PMID: 14527322 Review. - The mechanisms of lipid-protein rearrangements during viral infection.
Chizmadzhev YA. Chizmadzhev YA. Bioelectrochemistry. 2004 Jun;63(1-2):129-36. doi: 10.1016/j.bioelechem.2003.10.016. Bioelectrochemistry. 2004. PMID: 15110263 Review.
Cited by
- Mechanics of membrane fusion.
Chernomordik LV, Kozlov MM. Chernomordik LV, et al. Nat Struct Mol Biol. 2008 Jul;15(7):675-83. doi: 10.1038/nsmb.1455. Nat Struct Mol Biol. 2008. PMID: 18596814 Free PMC article. Review. - Fusogenic structural changes in arenavirus glycoproteins are associated with viroporin activity.
Zhang Y, York J, Brindley MA, Nunberg JH, Melikyan GB. Zhang Y, et al. PLoS Pathog. 2023 Jul 26;19(7):e1011217. doi: 10.1371/journal.ppat.1011217. eCollection 2023 Jul. PLoS Pathog. 2023. PMID: 37494374 Free PMC article. - High Transmembrane Voltage Raised by Close Contact Initiates Fusion Pore.
Bu B, Tian Z, Li D, Ji B. Bu B, et al. Front Mol Neurosci. 2016 Dec 9;9:136. doi: 10.3389/fnmol.2016.00136. eCollection 2016. Front Mol Neurosci. 2016. PMID: 28018169 Free PMC article. - SNARE-mediated lipid mixing depends on the physical state of the vesicles.
Chen X, Araç D, Wang TM, Gilpin CJ, Zimmerberg J, Rizo J. Chen X, et al. Biophys J. 2006 Mar 15;90(6):2062-74. doi: 10.1529/biophysj.105.071415. Epub 2005 Dec 16. Biophys J. 2006. PMID: 16361343 Free PMC article. - Cholesterol promotes hemifusion and pore widening in membrane fusion induced by influenza hemagglutinin.
Biswas S, Yin SR, Blank PS, Zimmerberg J. Biswas S, et al. J Gen Physiol. 2008 May;131(5):503-13. doi: 10.1085/jgp.200709932. J Gen Physiol. 2008. PMID: 18443361 Free PMC article.
References
- Blumenthal, R., and S. J. Morris. 1999. The influenza haemagglutinin-induced fusion cascade: effects of target membrane permeability changes. Mol. Membr. Biol. 16:43–47. - PubMed
- Bonnafous, P., and T. Stegmann. 2000. Membrane perturbation and fusion pore formation in influenza hemagglutinin-mediated membrane fusion: a new model for fusion. J. Biol. Chem. 275:6160–6166. - PubMed
- Chernomordik, L., M. M. Kozlov, and J. Zimmerberg. 1995. Lipids in biological membrane fusion. J. Membr. Biol. 146:1–14. - PubMed
Publication types
MeSH terms
Substances
LinkOut - more resources
Full Text Sources
Research Materials
Miscellaneous


