The strategy of T cell antigen-presenting cell encounter in antigen-draining lymph nodes revealed by imaging of initial T cell activation - PubMed (original) (raw)
The strategy of T cell antigen-presenting cell encounter in antigen-draining lymph nodes revealed by imaging of initial T cell activation
Marc Bajénoff et al. J Exp Med. 2003.
Abstract
The development of an immune response critically relies on the encounter of rare antigen (Ag)-specific T cells with dendritic cells (DCs) presenting the relevant Ag. How two rare cells find each other in the midst of irrelevant other cells in lymph nodes (LNs) is unknown. Here we show that initial T cell activation clusters are generated near high endothelial venules (HEVs) in the outer paracortex of draining LNs by retention of Ag-specific T cells as they exit from HEVs. We further show that tissue-derived DCs preferentially home in the vicinity of HEVs, thus defining the site of cluster generation. At this location DCs efficiently scan all incoming T cells and selectively retain those specific for the major histocompatibility complex-peptide complexes the DCs present. Such strategic positioning of DCs on the entry route of T cells into the paracortex may foster T cell-DC encounter and thus optimize initial T cell activation in vivo.
Figures
Figure 1.
Visualization of 3A9+ CD4+ T cell activation in situ. (a) CFSE-labeled 3A9+ CD4 T cells (green) were injected into recipient mice as described in Materials and Methods. 24 h later, mice were primed in the footpad with CFA (A–C) or CFA plus HEL (B–D). Draining popliteal LNs were harvested 24 or 48 h after immunization and analyzed by confocal microscopy. The B cell zones defined on sections as areas rich in B220+ cells appear in blue. Division of 3A9+ CD4 T cells was evaluated by FACS® analysis of CFSE dilution (inset in C and D). (b) Recipient mice were injected with CFA or CFA plus HEL 24 h before transfer of CMTMR-labeled 3A9 T cells (red) and CFSE-labeled nontransgenic T cells (blue). Draining LNs were harvested 24 h after T cell transfer and analyzed by confocal microscopy after staining with anti-CD25 Ab (green). 2 representative clusters of 3A9 T cells in sections of 2 different LNs, out of 14 analyzed, are shown for HEL-injected mice.
Figure 2.
Initial CD4+ T cell activation clusters localize near HEVs. (a) Mice were adoptively transferred with CMTMR-labeled 3A9+ CD4 T cells (red) and then primed 24 h later with CFA (A) or CFA plus HEL (B). Draining LNs were harvested 24 h after immunization. Sections were analyzed by confocal microscopy after staining with a B cell–specific (green) and an anti-PNAd Ab that specifically reacts with HEVs (blue). (b) The percentage of 3A9 T cells present within or outside the deep paracortex defined by the dashed line in (a) was counted as described in Materials and Methods. The mean percentage and SD of 9 and 14 individual LNs isolated from either CFA- or CFA/HEL-injected mice, respectively, is presented.
Figure 3.
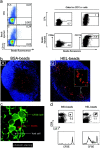
CD4+ T cells cluster around Ag-loaded DCs in the outer paracortex of draining LNs. (a) Mice were primed by subcutaneous injection of BSA-coupled fluorescent microspheres. Draining LNs from five mice were harvested 24 h later and the expression of CD11c, CD11b, and CD8α was examined by FACS® analysis of total LN cells or CD11c+ cells, as indicated. (b–d) Mice were adoptively transferred with dye-labeled 3A9 CD4 T cells and then primed 24 h later with BSA- or HEL-coupled fluorescent microspheres, as indicated. Draining LNs were harvested 24 h (b and c) or 3 d (d) after immunization. (b) Clustering of 3A9 T cells (red) with microsphere-positive cells (green) near the B cell area revealed by anti-B220 staining (blue) is shown. (c) Phalloidin staining highlights the tight interaction between 3A9 T cells (diffuse green staining) and bead-containing DCs (red dots). (d) FACS® analysis of CFSE profile of 3A9 T cells. One experiment out of two (a and c) or three (b and d) with similar results is presented.
Figure 4.
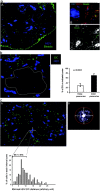
Ag-loaded DCs migrate preferentially near HEVs. (a) Mice were primed by subcutaneous injection of BSA-coupled fluorescent microspheres as in Fig. 3 a. Sections of draining LNs were stained with a PNAd-specific Ab (A and B, blue) and a CD11c-specific Ab (B, red), whereas beads appear in green. In C, sections were stained with the PNAd-specific Ab (white) and electronic sensitivity was increased to highlight the reticular network (arrowhead) that surrounds the HEV (arrow). ×160 in A and ×200 in B and C. One representative experiment out of three performed is shown. (b and c) BM-derived DCs were CMTMR labeled (green) and injected into the footpads of mice. LNs were collected 24 h later and sections were stained with a PNAd-specific Ab (blue). (b) The percentage of DCs present inside or outside the deep paracortex defined by the dashed line was calculated as indicated in Materials and Methods. The mean percentage and SD of 13 individual LNs is presented. (c) The distance between each DC and the most proximal HEV was calculated as described in Materials and Methods and the percentage of DCs within each distance interval was plotted (histogram). In addition, we defined a proximity perimeter around the HEV (A and B, arrows) with a radius of one and one half times the diameter of an HEV (A and B, refer to Results). The distance intervals included in this perimeter and the mean percentage ± SD of DCs within that perimeter are indicated on the histogram.
Figure 5.
DCs' placement near HEVs determine the localization of activation cluster. BM-derived DCs were pulsed with PCC or HEL peptide, labeled with CMTMR (green), and then injected into the footpads of recipient mice. 6 h later, CFSE-labeled 3A9 T cells (red) were adoptively transferred and draining LNs were collected 18 h after T cell transfer. The percentage of DC–T cell clusters in the deep or outer paracortex of mice injected with HEL-loaded DCs was measured as in Fig. 4 b. The mean percentage and SD of eight individual LNs is presented.
Figure 6.
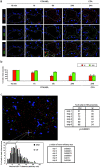
DCs scan incoming CD4 T cells nearby HEVs. (a) CFSE-labeled 3A9 CD4 T cells (3A9, green) and CMTMR-labeled nontransgenic CD4+ T cells (W, red) were coinjected into recipient mice immunized 24 h earlier with CFA or CFA/HEL, as indicated. Draining LNs were harvested at the indicated time points after adoptive transfer and analyzed by confocal microscopy after staining with a PNAd-specific Ab (blue). (b) The percentage of 3A9 CD4 T cells present in the outer paracortex (outside dashed circle) was calculated as described in Materials and Methods. The mean values and SD of four (CFA) and at least eight (CFA/HEL) different nodes analyzed in one representative experiment out of three performed are shown. (c) The minimal distance between 3A9 (solid bars) or wild-type (open bars) and the most proximal HEV was calculated as in Fig. 4 c and is presented in the histogram. Red stars delineate the boundaries of two distinct areas. In the first area, most proximal to the HEV (intervals 4–9), the 3A9 T cells are more frequent than the wild-type CD4 T cells. In the second area (intervals 10–27), more distant from the HEV, the wild-type CD4 T cells are more frequent than the 3A9 T cells. The distribution of 3A9 and wild-type CD4 T cells are significantly different based on a Mann and Whitney test of results obtained with six distinct LNs. The percentage of 3A9 or wild-type T cells within the proximity perimeter of an HEV was calculated as in Fig. 4 c and is presented for the six individual LNs analyzed.
Similar articles
- Antigen-bearing dendritic cells in the draining lymph nodes of contact sensitized mice: cluster formation with lymphocytes.
Cumberbatch M, Illingworth I, Kimber I. Cumberbatch M, et al. Immunology. 1991 Sep;74(1):139-45. Immunology. 1991. PMID: 1937567 Free PMC article. - Peptide-MHC potency governs dynamic interactions between T cells and dendritic cells in lymph nodes.
Skokos D, Shakhar G, Varma R, Waite JC, Cameron TO, Lindquist RL, Schwickert T, Nussenzweig MC, Dustin ML. Skokos D, et al. Nat Immunol. 2007 Aug;8(8):835-44. doi: 10.1038/ni1490. Epub 2007 Jul 15. Nat Immunol. 2007. PMID: 17632517 - The microanatomy of T-cell responses.
Lämmermann T, Sixt M. Lämmermann T, et al. Immunol Rev. 2008 Feb;221:26-43. doi: 10.1111/j.1600-065X.2008.00592.x. Immunol Rev. 2008. PMID: 18275473 Review. - Evidence for recruitment of plasmacytoid dendritic cell precursors to inflamed lymph nodes through high endothelial venules.
Yoneyama H, Matsuno K, Zhang Y, Nishiwaki T, Kitabatake M, Ueha S, Narumi S, Morikawa S, Ezaki T, Lu B, Gerard C, Ishikawa S, Matsushima K. Yoneyama H, et al. Int Immunol. 2004 Jul;16(7):915-28. doi: 10.1093/intimm/dxh093. Epub 2004 May 24. Int Immunol. 2004. PMID: 15159375 - T-cell activation by dendritic cells in the lymph node: lessons from the movies.
Bousso P. Bousso P. Nat Rev Immunol. 2008 Sep;8(9):675-84. doi: 10.1038/nri2379. Nat Rev Immunol. 2008. PMID: 19172690 Review.
Cited by
- The Deubiquitylase Otub1 Regulates the Chemotactic Response of Splenic B Cells by Modulating the Stability of the γ-Subunit Gng2.
Luo VM, Shen C, Worme S, Bhagrath A, Simo-Cheyou E, Findlay S, Hébert S, Wai Lam Poon W, Aryanpour Z, Zhang T, Zahedi RP, Boulais J, Buchwald ZS, Borchers CH, Côté JF, Kleinman CL, Mandl JN, Orthwein A. Luo VM, et al. Mol Cell Biol. 2024 Jan;44(1):1-16. doi: 10.1080/10985549.2023.2290434. Epub 2024 Jan 29. Mol Cell Biol. 2024. PMID: 38270191 - Illuminating T cell-dendritic cell interactions in vivo by FlAsHing antigens.
Akkaya M, Al Souz J, Williams D, Kamdar R, Kamenyeva O, Kabat J, Shevach E, Akkaya B. Akkaya M, et al. Elife. 2024 Jan 18;12:RP91809. doi: 10.7554/eLife.91809. Elife. 2024. PMID: 38236633 Free PMC article. - Same yet different - how lymph node heterogeneity affects immune responses.
Cruz de Casas P, Knöpper K, Dey Sarkar R, Kastenmüller W. Cruz de Casas P, et al. Nat Rev Immunol. 2024 May;24(5):358-374. doi: 10.1038/s41577-023-00965-8. Epub 2023 Dec 14. Nat Rev Immunol. 2024. PMID: 38097778 Review. - T-independent antigen induces humoral memory through germinal centers.
Liu X, Zhao Y, Qi H. Liu X, et al. J Exp Med. 2022 Mar 7;219(3):e20210527. doi: 10.1084/jem.20210527. Epub 2022 Jan 12. J Exp Med. 2022. PMID: 35019947 Free PMC article. - Effective CD4 T cell priming requires repertoire scanning by CD301b+ migratory cDC2 cells upon lymph node entry.
Tatsumi N, Codrington AL, El-Fenej J, Phondge V, Kumamoto Y. Tatsumi N, et al. Sci Immunol. 2021 Dec 10;6(66):eabg0336. doi: 10.1126/sciimmunol.abg0336. Epub 2021 Dec 10. Sci Immunol. 2021. PMID: 34890253 Free PMC article.
References
- Young, A.J. 1999. The physiology of lymphocyte migration through the single lymph node in vivo. Semin. Immunol. 11:73–83. - PubMed
- Banchereau, J., and R.M. Steinman. 1998. Dendritic cells and the control of immunity. Nature. 392:245–252. - PubMed
- Sallusto, F., and A. Lanzavecchia. 2000. Understanding dendritic cell and T-lymphocyte traffic through the analysis of chemokine receptor expression. Immunol. Rev. 177:134–140. - PubMed
- Mellman, I., and R.M. Steinman. 2001. Dendritic cells: specialized and regulated antigen processing machines. Cell. 106:255–258. - PubMed
- Sallusto, F., B. Palermo, D. Lenig, M. Miettinen, S. Matikainen, I. Julkunen, R. Forster, R. Burgstahler, M. Lipp, and A. Lanzavecchia. 1999. Distinct patterns and kinetics of chemokine production regulate dendritic cell function. Eur. J. Immunol. 29:1617–1625. - PubMed
Publication types
MeSH terms
Substances
LinkOut - more resources
Full Text Sources
Other Literature Sources
Miscellaneous


