Asymmetric distribution of myosin IIB in migrating endothelial cells is regulated by a rho-dependent kinase and contributes to tail retraction - PubMed (original) (raw)
Asymmetric distribution of myosin IIB in migrating endothelial cells is regulated by a rho-dependent kinase and contributes to tail retraction
John Kolega. Mol Biol Cell. 2003 Dec.
Abstract
All vertebrates contain two nonmuscle myosin II heavy chains, A and B, which differ in tissue expression and subcellular distributions. To understand how these distinct distributions are controlled and what role they play in cell migration, myosin IIA and IIB were examined during wound healing by bovine aortic endothelial cells. Immunofluorescence showed that myosin IIA skewed toward the front of migrating cells, coincident with actin assembly at the leading edge, whereas myosin IIB accumulated in the rear 15-30 min later. Inhibition of myosin light-chain kinase, protein kinases A, C, and G, tyrosine kinase, MAP kinase, and PIP3 kinase did not affect this asymmetric redistribution of myosin isoforms. However, posterior accumulation of myosin IIB, but not anterior distribution of myosin IIA, was inhibited by dominant-negative rhoA and by the rho-kinase inhibitor, Y-27632, which also inhibited myosin light-chain phosphorylation. This inhibition was overcome by transfecting cells with constitutively active myosin light-chain kinase. These observations indicate that asymmetry of myosin IIB, but not IIA, is regulated by light-chain phosphorylation mediated by rho-dependent kinase. Blocking this pathway inhibited tail constriction and retraction, but did not affect protrusion, suggesting that myosin IIB functions in pulling the rear of the cell forward.
Figures
Figure 1.
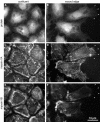
Asymmetric distribution of myosin IIA and myosin IIB in migrating endothelial cells. BAECs were fixed and stained 1 d after reaching confluence (A, C, and E) or 1 h after wounding the confluent monolayer (B, D, and F). The wound is at the right of the figure. Cells were stained with lysine-reactive cy5 to directly visualize total protein distribution (A and B) and with antibodies against myosin IIA (C and D) and myosin IIB (E and F), which were imaged by indirect immunofluorescence. Arrowheads in B, D, and F mark the location of the leading edges of one cell's lamellipodia. Note that the lamellar protrusions are very flat and contain much less protein mass compared with the cytoplasm around the nucleus, so the strong myosin IIA staining in the protrusions represents local concentration of myosin IIA. Myosin IIB is much less abundant toward the front of migrating cells, but is concentrated in cytoplasm at their trailing edges (F, arrows).
Figure 2.
Quantitation of the asymmetry of F-actin and myosin II in confluent and migrating cells. (A) Calculation of asymmetries: The cell was fixed, double-stained with lysine-reactive cy5 (to visualize protein distribution) and with rhodamine phalloidin (to show F-actin), and digital fluorescence images were acquired of both stains. The center of mass of protein in the cell (○) was taken as the center of mass of the cy5, calculated as described in MATERIALS AND METHODS. Similarly, the center of mass of F-actin (×) was calculated from the rhodamine phalloidin image. The displacement between the two centers gave the asymmetry vector for F-actin distribution in the cell. (B) F-actin asymmetries were measured as described in A for 25 cells in confluent monolayers (left) and for 25 cells migrating at the edge of a wound 1 h after wounding (right). Each arrow represents the asymmetry vector, in μm, for a single cell, and all vectors are plotted with the cell's protein center at the origin (0,0). Note the random orientation of asymmetries in confluent cells, and the larger, oriented asymmetries in migrating cells. (C) Fluorescence images were acquired of F-actin, myosin IIA, myosin IIB, and 40-kDa fluorescein dextran in confluent monolayers or at the edges of 1-h wounds. Asymmetry vectors were calculated for 30–40 cells in each case, and the mean projection onto the Y axis (i.e., in the direction of the wound) used to quantify polarization. Error bars indicate one SD from the mean; asterisks indicate values that are significantly different from 0 (p > 0.95). Only migrating cells displayed asymmetry in the distribution of actin and myosin II. Dextran, which acts as an inert volume indicator, did not polarize at all.
Figure 3.
Development of F-actin and myosin II asymmetry. Mean asymmetries of F-actin, myosin IIA, and myosin IIB were measured for cells along wound edges that were fixed at various times after wounding. To compare components more easily, values were normalized to the maximum mean asymmetry attained during the 2-h time course, which was observed at 120 min for F-actin and myosin IIA and at 60 min for myosin IIB. Each point represents the mean of 30–40 cells; error bars, 1 SD.
Figure 4.
Myosin II distribution in cells treated with ML-7 and Y-27632. BAECs were incubated for 15 min in 10 μM ML-7 to inhibit myosin light-chain kinase (A–C) or 2 μM Y-27632 to inhibit rho-dependent kinase (D and E). Cultures were wounded and cells were allowed to migrate in the continued presence of drug for 60 min before fixation and staining with lysine-reactive cy5 (A and D) and antibodies against myosin IIA (B and E) or myosin IIB (C and F). Arrowheads mark the leading edges of lamellipodia. Observe myosin IIB excluded from lamellar protrusions in ML-7–treated cells (C), but extending to the very edge of cells treated with Y-27632 (F). Myosin IIB was concentrated along the trailing edge in ML-7 (C, arrows), but not in Y-27632.
Figure 5.
Effects of kinase inhibitors on F-actin and myosin II asymmetry. BAECs were fixed and stained 60 min after wounding in the presence of: 0.5% dimethyl sulfoxide (control), 10 μM ML-7, 2 μM Y-27632, 1 μM K252b, 2 μM bisindolylmaleimide I, 1 μM KT5720, 10 μM PD98509, 10 μM genistein, 50 nM wortmannin, or 10 μM LY294002. Asymmetries were calculated for F-actin, myosin IIA, and myosin IIB from the images of 30–40 cells in each case; error bars, 1 SD. #Values that were moderately significantly different from controls (p > 0.9, but <0.95); *highly significant differences (p > 0.99).
Figure 6.
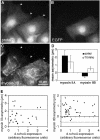
Reversal of myosin IIB asymmetry by dominant-negative rhoA. BAEC cultures that had been transiently transfected with EGFP-T19Nrho plasmids were fixed 1 h after wounding and then stained with lysine-reactive cy5 (A) and antibody against myosin IIB (C). EGFP fluorescence of the same field reveals plasmid expression (B). Arrowheads mark leading edges of migrating cells. The cell on the right was expressing high levels of plasmid encoding dominant-negative rhoA and displayed myosin IIB extending far into its lamellar protrusions, whereas its untransfected neighbor to the left excluded myosin IIB from the front and accumulated in the rear. Myosin IIA and myosin IIB asymmetries were calculated for 35 transfected and 35 untransfected cells, and mean values ± 1 SD are shown in D. (E) The asymmetry of myosin IIA (left) and myosin IIB (right) in individual cells plotted as a function of the expression levels of dominant-negative rhoA, as measured by GFP fluorescence. Dotted lines indicates the mean myosin II asymmetry in 20 untransfected cells in the same fields. Dominant-negative rhoA decreased myosin IIA asymmetry, but in no instance was it observed to cause negative asymmetry (i.e., posterior accumulation) of myosin IIA. For myosin IIB, even the lowest levels of plasmid expression (minimum detected = three times background fluorescence), inhibited the development of negative myosin IIB asymmetry, and myosin IIB became positively polarized (i.e., skewed toward the wound).
Figure 7.
Inhibition of myosin light-chain phosphorylation by Y-27632. Confluent cultures of BAECs were treated for 15 min with 0.5% dimethyl sulfoxide (control), 10 μM ML-7, or 2 μM Y-27632 and then wounded in continued presence of drugs by raking with a flea comb to create a high density of wound edges. After 1 h, cell lysates were separated by SDS-PAGE and transferred to nitrocellulose, and the bottom half was stained either with an antibody that specifically recognizes 20-kDa regulatory light chains of myosin II that have been phosphorylated at serine 19 (monophosphorylated, left) or an antibody against light chains phosphorylated at both serine 19 and threonine 18 (diphosphorylated, right). The top half of the blot was stained for myosin heavy chains (using a broadspecificity antibody against smooth- and nonmuscle heavy chains) to verify equal loading between lanes and is shown at the bottom of the panel. Light chain phosphorylation was markedly reduced in cells treated with Y-27632, but not ML-7.
Figure 8.
Distribution of phosphorylated regulatory light chains in migrating cells. BAECs were fixed and stained 1 h after wounding a confluent monolayer, with the wound at the top of the figure. Cells were triple-stained with antibodies against myosin II heavy chain A (A and D), myosin II heavy chain B (B and E), and myosin II regulatory light chains phosphorylated at either serine 19 (C) or serine 19 and threonine 18 (F). Both the mono- and di-phosphorylated light chains accumulated predominantly in bundles forming a U-shaped band along the posterio-lateral margins of migrating cells. This corresponds to accumulations of the B heavy chain. Smaller patches of phosphorylated light chains can be seen in nonspreading regions nearer to the front of the cells (arrows in C and F)
Figure 9.
Constitutively active MLCK can phosphorylate myosin II regulatory light chains in Y-27632–treated cells. BAEC cultures that had been transiently transfected with plasmid encoding FLAG-tagged, constitutively active MLCK were fixed 1 h after wounding in 2 μM Y-27632, then stained with lysine-reactive cy5 (A), antibody against the FLAG epitope on constitutively active MLCK (B), and antibody against myosin II regulatory light chains phosphorylated at serine 19 (C). The transfected cell (*) stained much more strongly for phosphorylated light chains than its untransfected neighbors. Note the strong localization of phosphorylated light chains along the lateral trailing edges of the cell.
Figure 10.
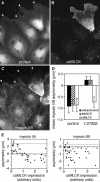
Constitutively active MLCK restores myosin IIB polarity in Y-27632–treated cells. BAEC cultures that had been transiently transfected with plasmid encoding FLAG-tagged, constitutively active MLCK were fixed 1 h after wounding in 2 μM Y-27632 and then stained with lysine-reactive cy5 (A), antibody against the FLAG epitope on constitutively active MLCK (B), and antibody against myosin IIB (C). Arrowheads mark leading edges of migrating cells. In untransfected cells, myosin IIB extended far into the lamellar protrusions, but it was excluded from the front of the cell at the upper right, which contained high levels of constitutively active MLCK. Note the heavy accumulation of myosin IIB along the rear of this cell (C, arrow), whereas myosin IIB was more generally distributed through the cytoplasm of untransfected neighboring cells. (D) Transfected cultures were fixed and stained after cells had migrated for 1 h in the presence or absence of Y-27632. Myosin IIB asymmetries were then calculated for cells transfected with constitutively active MLCK (caM-LCK), for cells transfected with dominant-negative MLCK (dnMLCK) and for untransfected cells. Mutant MLCKs did not affect asymmetry in control wounds, but constitutively active MLCK prevented the reversal of myosin IIB asymmetry caused by Y-27632. Error bars, 1 SD; n = 26 for each mean. (E) Asymmetries of myosin IIA (left) and myosin IIB (right) plotted as a function of the expression levels of constitutively active MLCK, as measured by the fluorescence intensity of FLAG staining. Dotted lines indicate the mean myosin II asymmetry in 20 untransfected cells in the same fields. At low levels of MLCK expression, myosin IIA asymmetry in transfected cells was less than the untransfected average, but it did not become negative in most cells until expression levels reached ∼1 U. Myosin IIB asymmetry was negative; i.e., skewed toward the tail even at very low levels of MLCK expression (∼0.2 U).
Figure 11.
Movements of the leading and trailing edges of migrating BAECs. Time-lapse movies were made of BAECs migrating at the edge of a wound in the presence (dotted lines, open symbols) or absence (solid lines, closed symbols) of 2 μM Y-27632. Each point represents the average distance moved toward the wound by the leading edges (circles) and trailing tails (triangles) of six cells migrating in the same experiment (error bars, 1 SD). The results shown are representative of three separate experiments. Note the constant distance between the leading and trailing edges of control cells after 50 min and the much larger separation between the front and rear of cells in Y-27632.
Figure 12.
Effects of Y-27632 on tail morphology. (A) Phase contrast micrographs of live, untreated cells 60 min after wounding illustrate the narrow, phase-dense tails (arrows) that developed as cells began to pull away from the edge of the monolayer. (B) Parallel cultures were wounded and imaged at the same time, but in the presence of 2 μM Y-27632. Bracket indicates a broad, flat tail on a cell that was just beginning to separate from its neighbors. (C) The width of the tail was measured 60 min after wounding in 48 untreated cells (▪) or 48 cells in 2 μM Y-27632 (□). Tail width was taken as the distance across the cell body along a line drawn parallel to the wound edge and located immediately posterior to the nucleus (e.g., dotted lines in A and B).
Similar articles
- Distinct roles of nonmuscle myosin II isoforms in the regulation of MDA-MB-231 breast cancer cell spreading and migration.
Betapudi V, Licate LS, Egelhoff TT. Betapudi V, et al. Cancer Res. 2006 May 1;66(9):4725-33. doi: 10.1158/0008-5472.CAN-05-4236. Cancer Res. 2006. PMID: 16651425 - Myosin IIA drives neurite retraction.
Wylie SR, Chantler PD. Wylie SR, et al. Mol Biol Cell. 2003 Nov;14(11):4654-66. doi: 10.1091/mbc.e03-03-0187. Epub 2003 Sep 5. Mol Biol Cell. 2003. PMID: 12960431 Free PMC article. - The C-terminal tail region of nonmuscle myosin II directs isoform-specific distribution in migrating cells.
Sandquist JC, Means AR. Sandquist JC, et al. Mol Biol Cell. 2008 Dec;19(12):5156-67. doi: 10.1091/mbc.e08-05-0533. Epub 2008 Oct 8. Mol Biol Cell. 2008. PMID: 18843042 Free PMC article. - Nonmuscle myosin-2: mix and match.
Heissler SM, Manstein DJ. Heissler SM, et al. Cell Mol Life Sci. 2013 Jan;70(1):1-21. doi: 10.1007/s00018-012-1002-9. Epub 2012 May 8. Cell Mol Life Sci. 2013. PMID: 22565821 Free PMC article. Review. - Mammalian nonmuscle myosin II comes in three flavors.
Shutova MS, Svitkina TM. Shutova MS, et al. Biochem Biophys Res Commun. 2018 Nov 25;506(2):394-402. doi: 10.1016/j.bbrc.2018.03.103. Epub 2018 Mar 17. Biochem Biophys Res Commun. 2018. PMID: 29550471 Free PMC article. Review.
Cited by
- Endothelial cells express a unique transcriptional profile under very high wall shear stress known to induce expansive arterial remodeling.
Dolan JM, Sim FJ, Meng H, Kolega J. Dolan JM, et al. Am J Physiol Cell Physiol. 2012 Apr 15;302(8):C1109-18. doi: 10.1152/ajpcell.00369.2011. Epub 2011 Dec 14. Am J Physiol Cell Physiol. 2012. PMID: 22173868 Free PMC article. - RNA protein interactions governing expression of the most abundant protein in human body, type I collagen.
Stefanovic B. Stefanovic B. Wiley Interdiscip Rev RNA. 2013 Sep-Oct;4(5):535-45. doi: 10.1002/wrna.1177. Epub 2013 May 28. Wiley Interdiscip Rev RNA. 2013. PMID: 23907854 Free PMC article. Review. - P-cadherin counteracts myosin II-B function: implications in melanoma progression.
Jacobs K, Van Gele M, Forsyth R, Brochez L, Vanhoecke B, De Wever O, Bracke M. Jacobs K, et al. Mol Cancer. 2010 Sep 22;9:255. doi: 10.1186/1476-4598-9-255. Mol Cancer. 2010. PMID: 20860798 Free PMC article. - Nonmuscle myosin IIA is involved in recruitment of apical junction components through activation of α-catenin.
Ozawa M. Ozawa M. Biol Open. 2018 Apr 30;7(5):bio031369. doi: 10.1242/bio.031369. Biol Open. 2018. PMID: 29654115 Free PMC article. - A biomechanical model for fluidization of cells under dynamic strain.
Wu T, Feng JJ. Wu T, et al. Biophys J. 2015 Jan 6;108(1):43-52. doi: 10.1016/j.bpj.2014.11.015. Biophys J. 2015. PMID: 25564851 Free PMC article.
References
- Amano, M., Chihara, K., Kimura, K., Fukata, Y., Nakamura, N., Matsuura, Y., and Kaibuchi, K. (1997). Formation of actin stress fibers and focal adhesions enhanced by rho-kinase. Science 275, 1308–1311. - PubMed
- Amano, M., Itoh, M., Kimura, K., Fukata, Y., Chihara, K., Nakano, T., Matsuura, Y., and Kaibuchi, K. (1996). Phosphorylation and activation of myosin by Rho-associated kinase (Rho-kinase). J. Biol. Chem. 271, 20246–20249. - PubMed
- Bhatia-Dey, N., Taira, M., Conti, M.A., Nooruddin, H., and Adelstein, R.S. (1998). Differential expression of non-muscle myosin heavy chain genes during Xenopus embryogenesis. Mech. Dev. 78, 33–36. - PubMed
- Choi, O.H., Park, C.S., Itoh, K., Adelstein, R.S., and Beaven, M.A. (1996). Cloning of the cDNA encoding rat myosin heavy chain-A and evidence for the absence of myosin heavy chain-B in cultured rat mast (RBL-2H3) cells. J Muscle Res. Cell Motil. 17, 69–77. - PubMed
Publication types
MeSH terms
Substances
LinkOut - more resources
Full Text Sources
Other Literature Sources


