Endothelial cell diversity revealed by global expression profiling - PubMed (original) (raw)
Endothelial cell diversity revealed by global expression profiling
Jen-Tsan Chi et al. Proc Natl Acad Sci U S A. 2003.
Abstract
The vascular system is locally specialized to accommodate widely varying blood flow and pressure and the distinct needs of individual tissues. The endothelial cells (ECs) that line the lumens of blood and lymphatic vessels play an integral role in the regional specialization of vascular structure and physiology. However, our understanding of EC diversity is limited. To explore EC specialization on a global scale, we used DNA microarrays to determine the expression profile of 53 cultured ECs. We found that ECs from different blood vessels and microvascular ECs from different tissues have distinct and characteristic gene expression profiles. Pervasive differences in gene expression patterns distinguish the ECs of large vessels from microvascular ECs. We identified groups of genes characteristic of arterial and venous endothelium. Hey2, the human homologue of the zebrafish gene gridlock, was selectively expressed in arterial ECs and induced the expression of several arterial-specific genes. Several genes critical in the establishment of left/right asymmetry were expressed preferentially in venous ECs, suggesting coordination between vascular differentiation and body plan development. Tissue-specific expression patterns in different tissue microvascular ECs suggest they are distinct differentiated cell types that play roles in the local physiology of their respective organs and tissues.
Figures
Fig. 1.
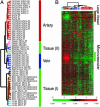
Diversity of EC gene expression patterns. (A) Gene expression patterns of cultured ECs organized by unsupervised hierarchical clustering. The global gene expression patterns of 53 cultured ECs were sorted based on similarity by hierarchical clustering. Approximately 6,900 genes were selected from the total data set, based on variations in expression relative to the mean expression level across all samples >3-fold in at least two cell samples. The sites of origin of each EC culture are indicated and color-coded. The anatomic origins of skin EC are indicated. The apparent order in the grouping of EC gene expression patterns is indicated to the right of the dendrogram. (B) Overview of gene expression patterns of all EC samples. The variations in gene expression described in A are shown in matrix format (5). The scale extends from 0.25- to 4-fold over mean (–2 to +2 in log2 space) as indicated on the left. Gray represents missing data. The gene clusters characteristic of large vessel and microvascular ECs are indicated on the right. Complete data can be found at
http://microarray-pubs.stanford.edu/endothelial
and in the Stanford Microarray Database (
http://genome-www5.stanford.edu/MicroArray/SMD
).
Fig. 2.
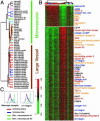
Large vessel and microvascular EC gene expression programs. (A) Identification of large vessel vs. microvascular ECs gene expression programs. Dendrogram representing the result of hierarchical clustering of EC samples, based on the similarities in their pattern of expression of the genes selected by Wilcoxon rank-sum test. (B) Features of large vessels and microvascular EC gene expression programs. A total of 521 large vessel-specific and 2,521 microvascular EC-specific genes are shown in ascending order of P values. Genes involved in ECM biosynthesis and interaction (blue), neuroglial signaling and migration (orange), angiogenesis (red), and lipid metabolism (black) are labeled by the indicated colors. (C) Validation of gene expression data by flow cytometry. Fluorescence-activated cell sorting analysis of surface expression of mannose receptor and α1 integrin on two ECs from dermal microcirculation (green, n = 2), one umbilical artery (red, n = 1), and one umbilical vein (blue, n = 1). Complete data can be found at
http://microarray-pubs.stanford.edu/endothelial
and in the Stanford Microarray Database (
http://genome-www5.stanford.edu/MicroArray/SMD
).
Fig. 3.
Artery and vein EC-specific gene expression programs. (A) Artery- or vein-specific genes identified by a Wilcoxon rank-sum test are shown in ascending order of P value within each gene list, and names of select artery-specific genes (red) and vein-specific genes (blue) are shown. Complete data can be found at
http://microarray-pubs.stanford.edu/endothelial
and in the Stanford Microarray Database (
http://genome-www5.stanford.edu/MicroArray/SMD
). (B) Strategy for identification of Hey2 target genes. HUVECs were infected by retrovirus expressing GFP or Hey2-IRES-GFP. The GPF-positive cells (labeled black bar) were sorted by fluorescence-activated cell sorting, and RNA from the sorted cells was reverse-transcribed with either Cy3 (GFP) or Cy5 (Hey2_GFP) and used for competitive hybridization to cDNA microarrays. (C) Induction of artery-specific genes by Hey2. Genes exhibiting >2-fold variation in expression in two of three independent experiments as described in B are shown. Genes previously identified as artery-specific in A are colored red, and vein-specific genes are colored blue. As an internal positive control, Hey2 expression was always higher in cells infected with Hey2_GFP retrovirus compared with cells infected with GFP retrovirus.
Fig. 4.
Identification of tissue-specific EC genes. (A) The expression patterns of tissue-specific genes as identified by Significance Analysis of Microarrays among all of the tissue microvascular ECs are shown. The clusters of genes with unique tissue expression in nasal polyps (pink), skin (brown), intestine (orange), lung (blue), and uterus (black) are marked by the indicated color and expanded on the right (B) with selected gene names. Complete data can be found at
http://microarray-pubs.stanford.edu/endothelial
and in the Stanford Microarray Database (
http://genome-www5.stanford.edu/MicroArray/SMD
).
Similar articles
- ERβ-dependent effects on uterine endothelial cells are cell specific and mediated via Sp1.
Greaves E, Collins F, Critchley HO, Saunders PT. Greaves E, et al. Hum Reprod. 2013 Sep;28(9):2490-501. doi: 10.1093/humrep/det235. Epub 2013 Jun 11. Hum Reprod. 2013. PMID: 23756706 Free PMC article. - Impact of Matrix Gel Variations on Primary Culture of Microvascular Endothelial Cell Function.
Burboa PC, Corrêa-Velloso JC, Arriagada C, Thomas AP, Durán WN, Lillo MA. Burboa PC, et al. Microcirculation. 2024 Jul;31(5):e12859. doi: 10.1111/micc.12859. Epub 2024 May 31. Microcirculation. 2024. PMID: 38818977 - Histone acetyltransferase 7 (KAT7)-dependent intragenic histone acetylation regulates endothelial cell gene regulation.
Yan MS, Turgeon PJ, Man HJ, Dubinsky MK, Ho JJD, El-Rass S, Wang YD, Wen XY, Marsden PA. Yan MS, et al. J Biol Chem. 2018 Mar 23;293(12):4381-4402. doi: 10.1074/jbc.RA117.001383. Epub 2018 Feb 6. J Biol Chem. 2018. PMID: 29414790 Free PMC article. - Endothelial cell diversity: the many facets of the crystal.
Perez-Gutierrez L, Li P, Ferrara N. Perez-Gutierrez L, et al. FEBS J. 2024 Aug;291(15):3287-3302. doi: 10.1111/febs.16660. Epub 2022 Oct 29. FEBS J. 2024. PMID: 36266750 Review. - Venous and arterial endothelial proteomics: mining for markers and mechanisms of endothelial diversity.
Richardson MR, Lai X, Witzmann FA, Yoder MC. Richardson MR, et al. Expert Rev Proteomics. 2010 Dec;7(6):823-31. doi: 10.1586/epr.10.92. Expert Rev Proteomics. 2010. PMID: 21142885 Free PMC article. Review.
Cited by
- Using cultured endothelial cells to study endothelial barrier dysfunction: Challenges and opportunities.
Aman J, Weijers EM, van Nieuw Amerongen GP, Malik AB, van Hinsbergh VW. Aman J, et al. Am J Physiol Lung Cell Mol Physiol. 2016 Aug 1;311(2):L453-66. doi: 10.1152/ajplung.00393.2015. Epub 2016 Jun 24. Am J Physiol Lung Cell Mol Physiol. 2016. PMID: 27343194 Free PMC article. Review. - New artery of knowledge: 3D models of angiogenesis.
Zucchelli E, Majid QA, Foldes G. Zucchelli E, et al. Vasc Biol. 2019 Dec 3;1(1):H135-H143. doi: 10.1530/VB-19-0026. eCollection 2019. Vasc Biol. 2019. PMID: 32923965 Free PMC article. Review. - Single-Cell RNA Sequencing Unveils Unique Transcriptomic Signatures of Organ-Specific Endothelial Cells.
Paik DT, Tian L, Williams IM, Rhee S, Zhang H, Liu C, Mishra R, Wu SM, Red-Horse K, Wu JC. Paik DT, et al. Circulation. 2020 Nov 10;142(19):1848-1862. doi: 10.1161/CIRCULATIONAHA.119.041433. Epub 2020 Sep 15. Circulation. 2020. PMID: 32929989 Free PMC article. - Microenvironmental regulation of hematopoietic stem cells and its implications in leukemogenesis.
Seshadri M, Qu CK. Seshadri M, et al. Curr Opin Hematol. 2016 Jul;23(4):339-45. doi: 10.1097/MOH.0000000000000251. Curr Opin Hematol. 2016. PMID: 27071022 Free PMC article. Review. - Human breast microvascular endothelial cells retain phenotypic traits in long-term finite life span culture.
Sigurdsson V, Fridriksdottir AJ, Kjartansson J, Jonasson JG, Steinarsdottir M, Petersen OW, Ogmundsdottir HM, Gudjonsson T. Sigurdsson V, et al. In Vitro Cell Dev Biol Anim. 2006 Nov-Dec;42(10):332-40. doi: 10.1290/0602017.1. In Vitro Cell Dev Biol Anim. 2006. PMID: 17316068
References
- St Croix, B., Rago, C., Velculescu, V., Traverso, G., Romans, K. E., Montgomery, E., Lal, A., Riggins, G. J., Lengauer, C., Vogelstein, B. & Kinzler, K. W. (2000) Science 289, 1197–1202. - PubMed
- Alizadeh, A. A., Eisen, M. B., Davis, R. E., Ma, C., Lossos, I. S., Rosenwald, A., Boldrick, J. C., Sabet, H., Tran, T., Yu, X., et al. (2000) Nature 403, 503–511. - PubMed
Publication types
MeSH terms
Substances
LinkOut - more resources
Full Text Sources
Other Literature Sources
Molecular Biology Databases
Miscellaneous


