Amplification of receptor signalling by Ca2+ entry-mediated translocation and activation of PLCgamma2 in B lymphocytes - PubMed (original) (raw)
Amplification of receptor signalling by Ca2+ entry-mediated translocation and activation of PLCgamma2 in B lymphocytes
Motohiro Nishida et al. EMBO J. 2003.
Abstract
In non-excitable cells, receptor-activated Ca2+ signalling comprises initial transient responses followed by a Ca2+ entry-dependent sustained and/or oscillatory phase. Here, we describe the molecular mechanism underlying the second phase linked to signal amplification. An in vivo inositol 1,4,5-trisphosphate (IP3) sensor revealed that in B lymphocytes, receptor-activated and store-operated Ca2+ entry greatly enhanced IP3 production, which terminated in phospholipase Cgamma2 (PLCgamma2)-deficient cells. Association between receptor-activated TRPC3 Ca2+ channels and PLCgamma2, which cooperate in potentiating Ca2+ responses, was demonstrated by co-immunoprecipitation. PLCgamma2-deficient cells displayed diminished Ca2+ entry-induced Ca2+ responses. However, this defect was canceled by suppressing IP3-induced Ca2+ release, implying that IP3 and IP3 receptors mediate the second Ca2+ phase. Furthermore, confocal visualization of PLCgamma2 mutants demonstrated that Ca2+ entry evoked a C2 domain-mediated PLCgamma2 translocation towards the plasma membrane in a lipase-independent manner to activate PLCgamma2. Strikingly, Ca2+ entry-activated PLCgamma2 maintained Ca2+ oscillation and extracellular signal-regulated kinase activation downstream of protein kinase C. We suggest that coupling of Ca2+ entry with PLCgamma2 translocation and activation controls the amplification and co-ordination of receptor signalling.
Figures
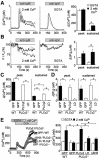
Fig. 1. Extracellular Ca2+ elicits sustained PLCγ2 activation and receptor-evoked [Ca2+]i mobilization. (A) Left, representative time courses of Ca2+ responses in DT40 cells upon BCR stimulation with anti-IgM (1 µg/ml) in 2 mM Ca2+-containing external (n = 32 cells) or EGTA-containing, Ca2+-free (n = 32) solution. Right, peak BCR-induced [Ca2+]i rises and [Ca2+]i increases sustained after 5 min stimulation. (B) Left, representative time courses of BCR-induced changes in florescence intensities of IP3 indicator R9-PHIP3-D106 (n = 12–15). F is the fluorescence intensity and F0 is the initial F. Right, BCR-induced [IP3]i changes at peak and sustained after 5 min. (C and D) BCR-induced [Ca2+]i rises (C) and [IP3]i rises (D) at peak and sustained after 6 min stimulation in WT cells expressing GFP (GFP/WT), and in PLCγ2– cells expressing GFP (GFP/PLCγ2–), PLCγ2 (PLCγ2/PLCγ2–) or LD mutant (LD/PLCγ2–) (n = 22–60). Ca2+ is present in external solution. (E) PLCγ2 enhances Ca2+ responses induced by Ca2+ entry upon M1R stimulation. Ca2+ release was first evoked in Ca2+-free solution, and Ca2+ entry-induced Ca2+ responses were induced by readministration of 2 mM Ca2+ in WT cells expressing GFP and in PLCγ2– cells expressing GFP, PLCγ2, LD or ΔSH3 (n = 5–13). Left, average time courses. Right, peak [Ca2+]i rises in Ca2+-free solution and after Ca2+ readministration. Significance difference from control: *P < 0.05.
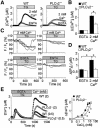
Fig. 2. Store-operated Ca2+ entry induced by passive depletion of Ca2+ stores activates PLCγ2. (A) Average time courses of Ca2+-responses induced by TG (2 µM) in WT (left) and PLCγ2– (right) cells in Ca2+-free or Ca2+-containing external solution (n = 18–33). (B) Peak [Ca2+]i rises induced by TG in WT and PLCγ2– cells. (C) Typical time courses of TG-induced changes in F/F0 of R9-PHIP3-D106 in WT (left) and PLCγ2– cells (right) in the presence (top) or absence (bottom) of extracellular Ca2+ (n = 7–15). (D) Peak TG-induced [IP3]i rises. (E) Dependence of TG-induced ‘off’ Ca2+ responses on extracellular Ca2+ concentrations in WT and PLCγ2– cells. The ‘off’ responses were induced after 12.5 min exposure to TG in Ca2+-free solution (n = 34–53). Right, peak [Ca2+]i rises plotted against extracellular Ca2+ concentration.
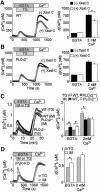
Fig. 3. Critical involvement of IP3-induced Ca2+ release in ‘off’ Ca2+ responses. (A and B) The IP3R blocker Xest C significantly suppresses TG-induced ‘off’ Ca2+ responses in WT (A) but not in PLCγ2– (B) cells (n = 23–48). Xest C (50 µM) was loaded with fura-2/AM using 0.1% Pluronic F-127 (Molecular Probes) for 30 min prior to [Ca2+]i measurements. During measurements, Xest C (50 µM) was added to perfusion solution for 20 min, and was omitted from Ca2+ readministration solution. Left, average time courses. Right, peak [Ca2+]i rises in Ca2+-free or Ca2+-containing external solution. (C) Left, average time courses of Ca2+ responses induced by TG and IM (1 µM) in WT and PLCγ2– cells (n = 16–33). Right, comparison between peak IM- and TG-induced [Ca2+]i rises in Ca2+-free or Ca2+-containing external solution. (D) Left, average time courses of Ca2+ responses induced by TG or IM in IP3R knockout cells. Right, peak IM- and TG-induced [Ca2+]i rises in Ca2+-free or Ca2+-containing solution.
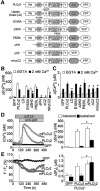
Fig. 4. The C2 domain mediates Ca2+ entry-induced activation of PLCγ2. (A) Schematic diagram for various mutant constructs of PLCγ2. (B) Peak BCR-induced [Ca2+]i rises during 5 min incubation in Ca2+-free solution and after subsequent readmission of Ca2+ in PLCγ2– cells expressing respective PLCγ2 mutants (n = 11–36). (C) Peak TG-induced [Ca2+]i rises in Ca2+-free solution and after readmission of Ca2+ in PLCγ2– cells expressing respective PLCγ2 mutants (n = 12–37). Protocol is the same as in Figure 2E. (D) Left, average time courses of BCR-induced Ca2+ responses in PLCγ2– cells expressing PLCγ2, membrane-bound PLCγ2 chimera (mPLCγ2) or GFP (n = 8–14). mPLCγ2 is composed of the human CD16 extracellular domain, the human TCR ζ-chain transmembrane domain and the complete rat PLCγ2 as a cytoplasmic domain (Ishiai et al., 1999). Right, BCR- induced [Ca2+]i rises at peak and sustained after 5 min. (E) Left, average time courses of BCR-induced F/F0 changes of R9-PHIP3-D106. Right, maximal [IP3]i elevation and sustained [IP3]i rises after 5 min upon BCR stimulation.
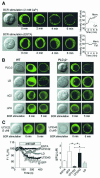
Fig. 5. Ca2+ influx induces translocation of PLCγ2 via the C2 domain. (A) Confocal fluorescence images indicating BCR-induced changes of subcellular localization of YFP-tagged PLCγ2 in PLCγ2– cells in Ca2+-containing or Ca2+-free solution (n = 5). Right, representative fluorescent changes of PLCγ2–EYFP distributed in 1 µm widths peripheral regions (Mem.) and in the rest the cytosolic areas (Cyt.). (B) Confocal images indicating changes of localization of PLCγ2 constructs (WT, LD, ΔC2 or ΔPH) in WT and PLCγ2– cells by 5 min BCR stimulation (n = 5). (C) PLC inhibitor U73122 blocks BCR-induced localization changes of LD in WT cells. Treatment with U73122 (3 µM) or its inactive analogue U73343 was started 20 min prior to BCR stimulation. Lower left, average time courses of BCR-induced F/F0 changes of R9-PHIP3-D106 in WT cells expressing GFP or LD, or pretreated with U73122 or U73343. Lower right, maximal [IP3]i elevation upon BCR stimulation.
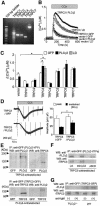
Fig. 6. Functional and physical association of PLCγ2 with the TRPC3 Ca2+ channel promotes receptor-evoked TRPC3 currents and Ca2+ responses. (A) RT–PCR analysis of RNA expression of TRPC homologues in DT40 cells. (B) Average time courses of Ca2+ responses upon stimulation of MRs in HEK cells expressing TRPC3 and/or PLCγ2 (WT or LD) (n = 32–38). (C) Peak MR-activated [Ca2+]i rises in HEK cells expressing respective TRPC1–C7 channels alone or along with PLCγ2. (D) Left, representative traces of ionic currents recorded from cells expressing TRPC3 alone or plus PLCγ2 at a holding potential of –60 mV. Right, peak and sustained (30 s after reaching peak) amplitudes of the MR-activated TRPC3 currents (n = 9–10). (E) Co-immunoprecipitation of TRPC3 and PLCγ2 via SH3. Immunoprecipitates (IP) with anti-GFP polyclonal antibody from TRPC3/GFP- and TRPC3/PLCγ2–YFP-expressing HEK cells (upper) or GFP/PLCγ2- and TRPC3–GFP/PLCγ2-expressing HEK cells (lower) were separated on 8% SDS-PAGE, and blotted with anti-PLCγ2 or anti-TRPC3 antibody, respectively, in western blot analysis (WB). (F) IP with the anti-GFP antibody from LD/TRPC3-, minΔC2/TRPC3- and ΔSH3/TRPC3-expressing HEK cells. Anti-TRPC3 antibody was used to assess co-immunoprecipitation in WB. All the PLCγ2 constructs were tagged with YFP. (G) IP with the anti-GFP antibody from TRPC3-GFP-expressing WT and TRPC3–GFP-expressing PLCγ2– cells with (+) or without (–) 5 min BCR stimulation (anti-IgM). Co-immunoprecipitation was assessed using anti-PLCγ2 antibody in WB.
Fig. 7. PLCγ2 requires its lipase activity and C2 domain to elicit BCR-evoked Ca2+ oscillation. (A–D) Representative time courses of BCR-induced Ca2+ responses in WT and PLCγ2– cells in Ca2+-containing (A–C and E–H) (n = 16–72) or Ca2+-free (D) (n = 50) solution (long time course, 60 min). PLCγ2 constructs were the same as those in Figure 4.
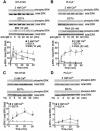
Fig. 8. Requirement of Ca2+ influx-dependent PLCγ2 activation for sustained BCR-induced activation of ERK in DT40. (A) WT or (B) PLCγ2– cells were stimulated with anti-IgM (1 µg/ml) for indicated time in the presence or absence of extracellular Ca2+. Treatment with BIM (10 µM) was started 10 min before BCR stimulation. PMA (50 nM) was applied to anti-IgM in PLCγ2– cells (B). (C and D) Average time courses of ERK activation evoked by TG (2 µM) in WT (C) and PLCγ2– (D) cells. The ERK activities were assessed by the quantification of its phosphorylation using phospho-specific antibody.
Fig. 9. Model for amplification of Ca2+ signalling by PLCγ2 in B lymphocytes. BCR stimulation induces activation of PLCγ2 via phosphorylation by Syk tyrosine kinase, and the activated PLCγ2 hydrolyses PIP2 to produce IP3. IP3 leads to Ca2+ release from ER and Ca2+ influx via TRPC3-containing receptor-activated Ca2+ channels (RACCs), which may correspond to SOCs activated through interaction with IP3R or to DG-activated Ca2+ channels. Ca2+ influx via RACC promotes lipase-independent PLCγ2 translocation from the cytosol to the plasma membrane (PM) by acting on the C2 domain. The targeted PLCγ2 is activated to hydrolyse PIP2 and produce IP3 and DG, which in turn induces Ca2+ release from ER and Ca2+ influx via Ca2+ entry channels such as TRPC3. PLCγ2 may also positively regulate TRPC3 channels via direct interaction.
Similar articles
- Requirements for distinct steps of phospholipase Cgamma2 regulation, membrane-raft-dependent targeting and subsequent enzyme activation in B-cell signalling.
Rodriguez R, Matsuda M, Storey A, Katan M. Rodriguez R, et al. Biochem J. 2003 Aug 15;374(Pt 1):269-80. doi: 10.1042/BJ20021778. Biochem J. 2003. PMID: 12780340 Free PMC article. - Bruton's tyrosine kinase is essential for hydrogen peroxide-induced calcium signaling.
Qin S, Chock PB. Qin S, et al. Biochemistry. 2001 Jul 10;40(27):8085-91. doi: 10.1021/bi0100788. Biochemistry. 2001. PMID: 11434777 - Feedback activation of phospholipase C via intracellular mobilization and store-operated influx of Ca2+ in insulin-secreting beta-cells.
Thore S, Dyachok O, Gylfe E, Tengholm A. Thore S, et al. J Cell Sci. 2005 Oct 1;118(Pt 19):4463-71. doi: 10.1242/jcs.02577. Epub 2005 Sep 13. J Cell Sci. 2005. PMID: 16159958 - Regulation of the phospholipase C-gamma2 pathway in B cells.
Kurosaki T, Maeda A, Ishiai M, Hashimoto A, Inabe K, Takata M. Kurosaki T, et al. Immunol Rev. 2000 Aug;176:19-29. doi: 10.1034/j.1600-065x.2000.00605.x. Immunol Rev. 2000. PMID: 11043765 Review. - Formation and actions of calcium-mobilizing messenger, inositol 1,4,5-trisphosphate.
Putney JW Jr. Putney JW Jr. Am J Physiol. 1987 Feb;252(2 Pt 1):G149-57. doi: 10.1152/ajpgi.1987.252.2.G149. Am J Physiol. 1987. PMID: 3030126 Review.
Cited by
- A Germline Mutation in the C2 Domain of PLCγ2 Associated with Gain-of-Function Expands the Phenotype for PLCG2-Related Diseases.
Novice T, Kariminia A, Del Bel KL, Lu H, Sharma M, Lim CJ, Read J, Lugt MV, Hannibal MC, O'Dwyer D, Hosler M, Scharnitz T, Rizzo JM, Zacur J, Priatel J, Abdossamadi S, Bohm A, Junker A, Turvey SE, Schultz KR, Rozmus J. Novice T, et al. J Clin Immunol. 2020 Feb;40(2):267-276. doi: 10.1007/s10875-019-00731-3. Epub 2019 Dec 19. J Clin Immunol. 2020. PMID: 31853824 Free PMC article. - TRPC channels in exercise-mimetic therapy.
Numaga-Tomita T, Oda S, Nishiyama K, Tanaka T, Nishimura A, Nishida M. Numaga-Tomita T, et al. Pflugers Arch. 2019 Mar;471(3):507-517. doi: 10.1007/s00424-018-2211-3. Epub 2018 Oct 8. Pflugers Arch. 2019. PMID: 30298191 Free PMC article. Review. - Selective and direct inhibition of TRPC3 channels underlies biological activities of a pyrazole compound.
Kiyonaka S, Kato K, Nishida M, Mio K, Numaga T, Sawaguchi Y, Yoshida T, Wakamori M, Mori E, Numata T, Ishii M, Takemoto H, Ojida A, Watanabe K, Uemura A, Kurose H, Morii T, Kobayashi T, Sato Y, Sato C, Hamachi I, Mori Y. Kiyonaka S, et al. Proc Natl Acad Sci U S A. 2009 Mar 31;106(13):5400-5. doi: 10.1073/pnas.0808793106. Epub 2009 Mar 16. Proc Natl Acad Sci U S A. 2009. PMID: 19289841 Free PMC article. - Mechanism of Rac1-induced amplification in gastric mucosal phospholipase Cγ2 activation in response to Helicobacter pylori: modulatory effect of ghrelin.
Slomiany BL, Slomiany A. Slomiany BL, et al. Inflammopharmacology. 2015 Jun;23(2-3):101-9. doi: 10.1007/s10787-015-0231-6. Epub 2015 Mar 22. Inflammopharmacology. 2015. PMID: 25796615 - TRPC3 and TRPC6 are essential for angiotensin II-induced cardiac hypertrophy.
Onohara N, Nishida M, Inoue R, Kobayashi H, Sumimoto H, Sato Y, Mori Y, Nagao T, Kurose H. Onohara N, et al. EMBO J. 2006 Nov 15;25(22):5305-16. doi: 10.1038/sj.emboj.7601417. Epub 2006 Nov 2. EMBO J. 2006. PMID: 17082763 Free PMC article.
References
- Ananthanarayanan B., Das,S., Rhee,S.G., Murray,D. and Cho,W. (2002) Membrane targeting of C2 domains of phospholipase C-δ isoforms. J. Biol. Chem., 277, 3568–3575. - PubMed
- Bae Y.S., Cantley,L.G., Chen,C.S., Kim,S.R., Kwon,K.S. and Rhee,S.G. (1998) Activation of phospholipase C-γ by phosphatidylinositol 3,4,5-trisphosphate. J. Biol. Chem., 273, 4465–4469. - PubMed
- Bairoch A. and Cox,J.A. (1990) EF-hand motifs in inositol phospholipid-specific phospholipase C. FEBS Lett., 269, 454–456. - PubMed
- Berridge M.J. (1993) Inositol trisphosphate and calcium signalling. Nature, 361, 315–325. - PubMed
Publication types
MeSH terms
Substances
LinkOut - more resources
Full Text Sources
Miscellaneous
