Systematic identification of regulatory proteins critical for T-cell activation - PubMed (original) (raw)
doi: 10.1186/1475-4924-2-21. Epub 2003 Sep 15.
Jorge Pardo # 1, Haoran Zhao # 1, Connie C Li 1 2, Erlina Pali 1, Mary M Shen 1, Kunbin Qu 1, Simon X Yu 1, Betty Cb Huang 1, Peiwen Yu 1 2, Esteban S Masuda 1, Susan M Molineaux 1, Frank Kolbinger 3, Gregorio Aversa 4, Jan de Vries 4, Donald G Payan 1, X Charlene Liao 1 5
Affiliations
- PMID: 12974981
- PMCID: PMC333404
- DOI: 10.1186/1475-4924-2-21
Systematic identification of regulatory proteins critical for T-cell activation
Peter Chu et al. J Biol. 2003.
Abstract
Background: The activation of T cells, mediated by the T-cell receptor (TCR), activates a battery of specific membrane-associated, cytosolic and nuclear proteins. Identifying the signaling proteins downstream of TCR activation will help us to understand the regulation of immune responses and will contribute to developing therapeutic agents that target immune regulation.
Results: In an effort to identify novel signaling molecules specific for T-cell activation we undertook a large-scale dominant effector genetic screen using retroviral technology. We cloned and characterized 33 distinct genes from over 2,800 clones obtained in a screen of 7 x 10⁸ Jurkat T cells on the basis of a reduction in TCR-activation-induced CD69 expression after expressing retrovirally derived cDNA libraries. We identified known signaling molecules such as Lck, ZAP70, Syk, PLC gamma 1 and SHP-1 (PTP1C) as truncation mutants with dominant-negative or constitutively active functions. We also discovered molecules not previously known to have functions in this pathway, including a novel protein with a RING domain (found in a class of ubiquitin ligases; we call this protein TRAC-1), transmembrane molecules (EDG1, IL-10R alpha and integrin alpha2), cytoplasmic enzymes and adaptors (PAK2, A-Raf-1, TCPTP, Grb7, SH2-B and GG2-1), and cytoskeletal molecules (moesin and vimentin). Furthermore, using truncated Lck, PLC gamma 1, EDG1 and PAK2 mutants as examples, we showed that these dominant immune-regulatory molecules interfere with IL-2 production in human primary lymphocytes.
Conclusions: This study identified important signal regulators in T-cell activation. It also demonstrated a highly efficient strategy for discovering many components of signal transduction pathways and validating them in physiological settings.
Figures
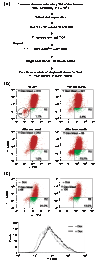
Figure 1
Cell-line and assay development. (a) ZAP70 KI and ZAP70 SH2 (N+C) were subcloned in front of the internal ribosome entry site (IRES), followed by GFP, in the Tet-regulated retroviral vector (pTRA-IRES-GFP). (b) After infecting tTA-expressing Jurkat (4D9#32) cells with retroviral constructs containing IRES-GFP, ZAP70 KI-IRES-GFP, or ZAP70 SH2 (N+C)-IRES-GFP, cells were left unstimulated or stimulated with anti-TCR antibody for 24 h. CD69 expression was analyzed after gating on the GFP-positive population (infected population, boxed in R1). The dashed line and the thin line on the graphs indicate cells infected with IRES-GFP (vector) before and after TCR stimulation, respectively, and the thick line indicates cells infected with ZAP70 KI-IRES-GFP (top panel) or ZAP70 SH2 (N+C)-IRES-GFP (bottom panel), both after TCR stimulation. (c) After infecting Jurkat-tTA (4D9#32) cells with retroviral vector alone or vector containing ZAP70 SH2 (N+C)-IRES-GFP, cells were cultured without (top panels) or with (bottom panels) Dox for 6 days, and then left unstimulated or stimulated with anti-TCR antibody for 24 h. The box R1 indicates GFP-positive cells. CD69 expression was analyzed for the entire cell population. The dashed line and the thin line indicate cells infected with vector before and after TCR stimulation, respectively, and the thick line indicates cells infected with vector containing ZAP70 SH2 (N+C)-IRES-GFP after TCR stimulation. (d) The Jurkat-tTA (4D9#32) cells containing different retroviral constructs (shown above the lanes) were cultured in the absence (-) or presence (+) of Dox, and whole-cell lysates were prepared. Lysates were loaded (100 μg per lane) and analyzed by western blotting using anti-ZAP70 antibody (Upstate Biotechnology, Waltham, USA). The top ZAP70 band included endogenous (- and + Dox) as well as retrovirally expressed ZAP70 (-Dox only), whereas the bottom ZAP70 band contained only retrovirally expressed truncated ZAP70 SH2 (N+C).
Figure 2
Screen for inhibitors of TCR-activation-induced CD69 expression. (a) Cells (3.5 × 10⁸) were infected with pTRA-cDNA libraries. Single-cells were cloned after at least four consecutive sortings of the CD69lowCD3+ phenotype. (b) Cells (7.1 × 10⁸) were sorted with high-speed flow sorters (MoFlo) after stimulation and staining with anti-CD69-APC and anti-CD3-PE. The sort gate was set at the equivalent of 1% of satellite control cells that were stimulated but never flow-sorted (shown as R2) to enrich for the CD69lowCD3+ phenotype. After sorting, the desired cells were allowed to rest for 6 days before another round of stimulation and sorting. (c) Cells were split into two populations after the third round of sorting. One half of the cells were grown in the absence of Dox (top left dot-plot) and the other half in the presence of Dox (top right dot-plot). Six days later, CD69 expression was compared following anti-TCR stimulation. The dashed line indicates CD69 level without Dox and the solid line with Dox (bottom graph).
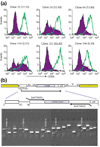
Figure 3
Identification of clones with desired phenotype. (a) Individual clones were grown in the presence (open peaks) or absence (filled peaks) of Dox for 6 days and then stimulated to examine CD69 expression by FACS. The 'Dox ratio' was defined as the ratio of CD69 geometric mean fluorescent intensity in the presence of Dox divided by CD69 geometric mean fluorescent intensity in the absence of Dox and is indicated in parentheses following the clone number. (b) DNA oligonucleotide primers specific to the library vector (BstXTRA5G and BstXTRA3D, not to scale) were used in RT-PCRs to recover the cDNA inserts from cell clones. The RT-PCR products were analyzed in agarose gel followed by ethidium blue staining. Data from representative clones are shown alongside the 1 kb DNA molecular weight ladder (Mr) from New England BioLabs (Beverly, USA).
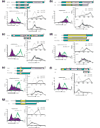
Figure 4
Transfer of selected hits from the functional genetic screen to naïve Jurkat-tTA (4D9#32) cells. Diagrams of proteins predicted from the cDNA inserts and those from the corresponding wild-type genes are shown above the histograms. The left panel of histograms shows the phenotype of the original cell clones in the presence (open peaks) or absence (filled peaks) of Dox as analyzed in Figure 3a. The Dox ratio is indicated. The right top and bottom panels of histograms show the phenotypes after expressing the cDNA inserts (followed by IRES-GFP) in a naïve Jurkat-tTA population. After retroviral infection, the Jurkat-tTA (4D9#32) cells were either stimulated with the anti-TCR antibody (solid line) or left unstimulated (dashed line), and analyzed by FACS for CD69 induction after staining with anti-CD69-APC. The top right histogram in each group analyzed GFP-negative cells, which did not express the cDNA hit, whereas the bottom right histogram in each group analyzed GFP-positive cells, which expressed the cDNA hit. The following cDNA hits are shown: (a) ZAP70; (b) Lck; (c) PLC31; (d) EDG1; (e) PAK2; (f) Grb7; (g) TRAC-1.
Figure 5
EDG1, PAK2, Grb7 and TRAC-1 expression in normal human tissues and lymphocyte subsets. (a,b) Northern blot analysis using multi-tissue blot (Clontech). The following genes are shown: (a) EDG1 and PAK2; (b) Grb7 and TRAC-1. (c-f) Semi-quantitative PCR analysis of gene expression in lymphocyte subsets. The cDNA templates were obtained from CD4+ T cells, CD8+ T cells, CD19+ B cells, or CD14+monocytes (human blood fractions MTC panel from Clontech). Specific target primers or control primers were used in PCR reactions. The following genes are shown: (c) EDG1; (d) PAK2; (e) Grb7; (f) TRAC-1.
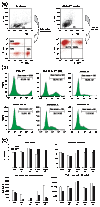
Figure 6
The cDNA hits from the functional genetic screens inhibited activation in human primary T lymphocytes. (a) Human PBL were cultured with anti-CD3 and anti-CD28 for 3 days and then infected with the retroviral CRU5-GFP vector, whereby GFP was expressed from the constitutively active retroviral LTR promoter. Cells were stained with anti-CD3-APC, or with anti-CD4-PE and anti-CD8-APC antibodies and analyzed by FACS. The percentage of cells in each quadrant is shown. (b) Human primary T lymphocytes were infected with vector alone (CRU5-GFP and CRU5-IRES-GFP or CIG) or with the CIG vector expressing the Lck, PLCγ1, EDG1 and PAK2 hits. The infection rate was monitored by the percentage of GFP-positive cells (marked with M1). The geometric mean of GFP for cells in marker M1 was shown above the marker line. (c) Infected primary T lymphocytes were allowed to rest and then sorted to give rise to GFP-negative (open bars) and GFP-positive (filled bars) populations. Equal numbers of cells were cultured without stimulation, with anti-CD3 or anti-CD3 plus anti-CD28 antibodies, or with PMA plus ionomycin. Then, 40 h later the culture supernatants were harvested and assayed for IL-2 production by ELISA. Note the difference in the scales and the standard deviations with cells stimulated with anti-CD3 plus anti-CD28, or with PMA plus ionomycin (lower panels) compared to the upper panels.
Similar articles
- A novel role for p21-activated protein kinase 2 in T cell activation.
Chu PC, Wu J, Liao XC, Pardo J, Zhao H, Li C, Mendenhall MK, Pali E, Shen M, Yu S, Taylor VC, Aversa G, Molineaux S, Payan DG, Masuda ES. Chu PC, et al. J Immunol. 2004 Jun 15;172(12):7324-34. doi: 10.4049/jimmunol.172.12.7324. J Immunol. 2004. PMID: 15187108 - Vav2 activates c-fos serum response element and CD69 expression but negatively regulates nuclear factor of activated T cells and interleukin-2 gene activation in T lymphocyte.
Tartare-Deckert S, Monthouel MN, Charvet C, Foucault I, Van Obberghen E, Bernard A, Altman A, Deckert M. Tartare-Deckert S, et al. J Biol Chem. 2001 Jun 15;276(24):20849-57. doi: 10.1074/jbc.M010588200. Epub 2001 Mar 21. J Biol Chem. 2001. PMID: 11262396 - A novel E3 ubiquitin ligase TRAC-1 positively regulates T cell activation.
Zhao H, Li CC, Pardo J, Chu PC, Liao CX, Huang J, Dong JG, Zhou X, Huang Q, Huang B, Bennett MK, Molineaux SM, Lu H, Daniel-Issakani S, Payan DG, Masuda ES. Zhao H, et al. J Immunol. 2005 May 1;174(9):5288-97. doi: 10.4049/jimmunol.174.9.5288. J Immunol. 2005. PMID: 15843525 - Multiple signal transduction pathways activated through the T cell receptor for antigen.
Siegel JN, Egerton M, Phillips AF, Samelson LE. Siegel JN, et al. Semin Immunol. 1991 Sep;3(5):325-34. Semin Immunol. 1991. PMID: 1724737 Review. - The role of membrane-associated adaptors in T cell receptor signalling.
Zhang W, Samelson LE. Zhang W, et al. Semin Immunol. 2000 Feb;12(1):35-41. doi: 10.1006/smim.2000.0205. Semin Immunol. 2000. PMID: 10723796 Review.
Cited by
- Large-scale cDNA transfection screening for genes related to cancer development and progression.
Wan D, Gong Y, Qin W, Zhang P, Li J, Wei L, Zhou X, Li H, Qiu X, Zhong F, He L, Yu J, Yao G, Jiang H, Qian L, Yu Y, Shu H, Chen X, Xu H, Guo M, Pan Z, Chen Y, Ge C, Yang S, Gu J. Wan D, et al. Proc Natl Acad Sci U S A. 2004 Nov 2;101(44):15724-9. doi: 10.1073/pnas.0404089101. Epub 2004 Oct 21. Proc Natl Acad Sci U S A. 2004. PMID: 15498874 Free PMC article. - Immune and sex-biased gene expression in the threatened Mojave desert tortoise, Gopherus agassizii.
Xu C, Dolby GA, Drake KK, Esque TC, Kusumi K. Xu C, et al. PLoS One. 2020 Aug 26;15(8):e0238202. doi: 10.1371/journal.pone.0238202. eCollection 2020. PLoS One. 2020. PMID: 32846428 Free PMC article. - Proteomic identification of carbonylated proteins in the kidney of trichloroethene-exposed MRL+/+ mice.
Fan X, Wang G, English RD, Firoze Khan M. Fan X, et al. Toxicol Mech Methods. 2014 Jan;24(1):21-30. doi: 10.3109/15376516.2013.843112. Epub 2013 Oct 7. Toxicol Mech Methods. 2014. PMID: 24024666 Free PMC article. - Signaling advances from immunogenetics to immunogenomics.
Boothby M. Boothby M. Genome Biol. 2003;4(12):239. doi: 10.1186/gb-2003-4-12-239. Epub 2003 Nov 19. Genome Biol. 2003. PMID: 14659009 Free PMC article. Review. - Targeting S1PR1 May Result in Enhanced Migration of Cancer Cells in Bladder Carcinoma.
Chen CL, Meng E, Wu ST, Lai HF, Lu YS, Yang MH, Tsao CW, Kao CC, Chiu YL. Chen CL, et al. Cancers (Basel). 2021 Sep 5;13(17):4474. doi: 10.3390/cancers13174474. Cancers (Basel). 2021. PMID: 34503284 Free PMC article.
References
- Marrack P, Kappler J. The T cell receptor. Science. 1987;238:1073–1079. - PubMed
- Dustin ML, Chan AC. Signaling takes shape in the immune system. Cell. 2000;103:283–294. - PubMed
MeSH terms
Substances
LinkOut - more resources
Full Text Sources
Other Literature Sources
Molecular Biology Databases
Research Materials
Miscellaneous


