Molecular diagnosis of primary mediastinal B cell lymphoma identifies a clinically favorable subgroup of diffuse large B cell lymphoma related to Hodgkin lymphoma - PubMed (original) (raw)
. 2003 Sep 15;198(6):851-62.
doi: 10.1084/jem.20031074.
George Wright, Karen Leroy, Xin Yu, Philippe Gaulard, Randy D Gascoyne, Wing C Chan, Tong Zhao, Corinne Haioun, Timothy C Greiner, Dennis D Weisenburger, James C Lynch, Julie Vose, James O Armitage, Erlend B Smeland, Stein Kvaloy, Harald Holte, Jan Delabie, Elias Campo, Emili Montserrat, Armando Lopez-Guillermo, German Ott, H Konrad Muller-Hermelink, Joseph M Connors, Rita Braziel, Thomas M Grogan, Richard I Fisher, Thomas P Miller, Michael LeBlanc, Michael Chiorazzi, Hong Zhao, Liming Yang, John Powell, Wyndham H Wilson, Elaine S Jaffe, Richard Simon, Richard D Klausner, Louis M Staudt
Affiliations
- PMID: 12975453
- PMCID: PMC2194208
- DOI: 10.1084/jem.20031074
Molecular diagnosis of primary mediastinal B cell lymphoma identifies a clinically favorable subgroup of diffuse large B cell lymphoma related to Hodgkin lymphoma
Andreas Rosenwald et al. J Exp Med. 2003.
Abstract
Using current diagnostic criteria, primary mediastinal B cell lymphoma (PMBL) cannot be distinguished from other types of diffuse large B cell lymphoma (DLBCL) reliably. We used gene expression profiling to develop a more precise molecular diagnosis of PMBL. PMBL patients were considerably younger than other DLBCL patients, and their lymphomas frequently involved other thoracic structures but not extrathoracic sites typical of other DLBCLs. PMBL patients had a relatively favorable clinical outcome, with a 5-yr survival rate of 64% compared with 46% for other DLBCL patients. Gene expression profiling strongly supported a relationship between PMBL and Hodgkin lymphoma: over one third of the genes that were more highly expressed in PMBL than in other DLBCLs were also characteristically expressed in Hodgkin lymphoma cells. PDL2, which encodes a regulator of T cell activation, was the gene that best discriminated PMBL from other DLBCLs and was also highly expressed in Hodgkin lymphoma cells. The genomic loci for PDL2 and several neighboring genes were amplified in over half of the PMBLs and in Hodgkin lymphoma cell lines. The molecular diagnosis of PMBL should significantly aid in the development of therapies tailored to this clinically and pathogenetically distinctive subgroup of DLBCL.
Figures
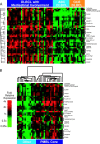
Figure 1.
Identification of a PMBL gene expression signature. (A) Hierarchical clustering identified a set of 23 PMBL signature genes that were more highly expressed in most lymphomas with a clinical diagnosis of PMBL than in lymphomas assigned to the GCB or ABC DLBCL subgroups. Each row presents gene expression measurements from a single Lymphochip microarray feature representing the genes indicated. Each column represents a single lymphoma biopsy sample. Relative gene expression is depicted according to the color scale shown. (B) Hierarchical clustering of the lymphoma biopsy samples based on expression of the PMBL signature genes identified in A. A “core” cluster of lymphoma cases was identified that highly expressed the PMBL signature genes.
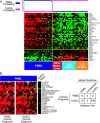
Figure 2.
Development of a gene expression-based molecular diagnosis of PMBL. (A) A PMBL predictor was created based on the expression of the 46 genes shown. Relative gene expression for each lymphoma biopsy sample is presented according to the color scale shown in Fig. 1. The probability that each sample is PMBL or DLBCL based on gene expression is shown at the top. See Results for details. (B) Validation of the PMBL predictor. The PMBL predictor was used to classify 274 lymphoma samples from an independent cohort of patients (4) as PMBL or DLBCL. Some patients had been diagnosed as PMBL based on current diagnostic criteria (PMBL clinical diagnosis), whereas others had not been given this diagnosis (DLBCL clinical diagnosis). The prediction results are summarized on the right, and the relative gene expression for each case that was classified by the predictor as PMBL is shown on the left. In addition, the average expression of each gene in the samples classified as DLBCL is shown. Shown are the 20 genes from the PMBL predictor (A) that were more highly expressed in PMBL than in DLBCL and that were represented on the Lymphochip microarrays used to profile this set of lymphoma samples (4). Not shown are eight genes from the PMBL predictor that were more highly expressed in DLBCL than in PMBL.
Figure 3.
Clinical characteristics of PMBL patients. (A) Kaplan-Meier plot of overall survival of PMBL, GCB DLBCL, and ABC DLBCL patients after chemotherapy. (B) Distribution of extranodal sites of disease involvement at diagnosis for PMBL and other DLBCL patients.
Figure 4.
Amplification of genes on chromosome band 9p24 in PMBL. (A) The genomic copy number of the PDL2 gene on chromosome arm 9p is compared with that of the control PRKCQ gene. A PDL2 to PRKCQ ratio above the threshold indicated by the dashed line was taken as evidence of a gain/amplification of the PDL2 genomic locus (see Materials and Methods for details). HL, Hodgkin lymphoma cell lines L428, HDLM2, and L540. Normal control is defined as peripheral blood mononuclear cell samples from normal volunteers. (B) Coamplification of the PDL2, JAK2, and SMARCA2 genes in PMBL. The genomic copy numbers of the JAK2 and SMARCA2 genes relative to the control CDKN2C gene are shown for seven PMBL cases with greater than twofold amplification of PDL2 (A) and for three normal control samples. The structure of the chromosome 9p24 region near the PDL2 gene is shown. cen, centromere; tel, telomere.
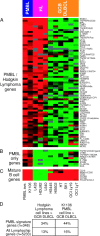
Figure 5.
Relationship of PMBL to Hodgkin lymphoma. Relative gene expression is shown in primary PMBLs (average of all biopsy samples), the PMBL cell line K1106, three Hodgkin lymphoma (HL) cell lines, and six GCB DLBCL cell lines, according to the color scale shown in Fig. 1. (A) PMBL signature genes that are also expressed at high levels in Hodgkin lymphoma cell lines compared with GCB DLBCL cell lines. (B) PMBL signature genes not expressed in Hodgkin lymphoma cell lines. (C) Mature B cell markers expressed in PMBL and GCB DLBCL but not in Hodgkin lymphoma. (D) Enrichment within the set of PMBL signature genes of genes highly expressed in Hodgkin lymphoma cell lines or in the K1106 PMBL cell line relative to GCB DLBCL cell lines. See Results for details.
Figure 6.
Expression of PMBL signature genes in primary HRS cells. (A) Quantitative RT-PCR measurement of mRNA levels for CCL17/TARC, SNFT, MAL, and TNFRSF6/Fas in the indicated cell types. mRNA expression for each gene is presented relative to the expression of _ACTB/β_-actin. (B) Immunohistochemical staining of MAL protein in a malignant HRS cell from a case of nodular sclerosis classical Hodgkin lymphoma.
Similar articles
- Identification of Primary Mediastinal Large B-cell Lymphoma at Nonmediastinal Sites by Gene Expression Profiling.
Yuan J, Wright G, Rosenwald A, Steidl C, Gascoyne RD, Connors JM, Mottok A, Weisenburger DD, Greiner TC, Fu K, Smith L, Rimsza LM, Jaffe ES, Campo E, Martinez A, Delabie J, Braziel RM, Cook JR, Ott G, Vose JM, Staudt LM, Chan WC; Lymphoma Leukemia Molecular Profiling Project (LLMPP). Yuan J, et al. Am J Surg Pathol. 2015 Oct;39(10):1322-30. doi: 10.1097/PAS.0000000000000473. Am J Surg Pathol. 2015. PMID: 26135560 Free PMC article. - Distinguishing of primary mediastinal B-cell lymphoma and diffuse large B-cell lymphoma using real-time quantitative polymerase chain reaction.
Votavova H, Forsterova K, Campr V, Sritesky J, Velenska Z, Pytlik R, Kubackova K, Prochazka B, Kodet R, Spicka I, Krejcova H, Trneny M, Klener P. Votavova H, et al. Neoplasma. 2010;57(5):449-54. doi: 10.4149/neo_2010_05_449. Neoplasma. 2010. PMID: 20568899 - Primary mediastinal B-cell lymphoma: hypermutation of the BCL6 gene targets motifs different from those in diffuse large B-cell and follicular lymphomas.
Malpeli G, Barbi S, Moore PS, Scardoni M, Chilosi M, Scarpa A, Menestrina F. Malpeli G, et al. Haematologica. 2004 Sep;89(9):1091-9. Haematologica. 2004. PMID: 15377470 - The biology of human lymphoid malignancies revealed by gene expression profiling.
Staudt LM, Dave S. Staudt LM, et al. Adv Immunol. 2005;87:163-208. doi: 10.1016/S0065-2776(05)87005-1. Adv Immunol. 2005. PMID: 16102574 Free PMC article. Review. - Malignant hematopoietic cell lines: in vitro models for the study of primary mediastinal B-cell lymphomas.
Drexler HG, Ehrentraut S, Nagel S, Eberth S, MacLeod RA. Drexler HG, et al. Leuk Res. 2015 Jan;39(1):18-29. doi: 10.1016/j.leukres.2014.11.002. Epub 2014 Nov 21. Leuk Res. 2015. PMID: 25480038 Review.
Cited by
- Gambogic acid induces apoptosis in diffuse large B-cell lymphoma cells via inducing proteasome inhibition.
Shi X, Lan X, Chen X, Zhao C, Li X, Liu S, Huang H, Liu N, Zang D, Liao Y, Zhang P, Wang X, Liu J. Shi X, et al. Sci Rep. 2015 Apr 8;5:9694. doi: 10.1038/srep09694. Sci Rep. 2015. PMID: 25853502 Free PMC article. - Detection of Enhancer-Associated Rearrangements Reveals Mechanisms of Oncogene Dysregulation in B-cell Lymphoma.
Ryan RJ, Drier Y, Whitton H, Cotton MJ, Kaur J, Issner R, Gillespie S, Epstein CB, Nardi V, Sohani AR, Hochberg EP, Bernstein BE. Ryan RJ, et al. Cancer Discov. 2015 Oct;5(10):1058-71. doi: 10.1158/2159-8290.CD-15-0370. Epub 2015 Jul 30. Cancer Discov. 2015. PMID: 26229090 Free PMC article. - The molecular biology of diffuse large B-cell lymphoma.
Frick M, Dörken B, Lenz G. Frick M, et al. Ther Adv Hematol. 2011 Dec;2(6):369-79. doi: 10.1177/2040620711419001. Ther Adv Hematol. 2011. PMID: 23556103 Free PMC article. - The histological and biological spectrum of diffuse large B-cell lymphoma in the World Health Organization classification.
Menon MP, Pittaluga S, Jaffe ES. Menon MP, et al. Cancer J. 2012 Sep-Oct;18(5):411-20. doi: 10.1097/PPO.0b013e31826aee97. Cancer J. 2012. PMID: 23006945 Free PMC article. Review. - Genetic lesions in diffuse large B-cell lymphomas.
Testoni M, Zucca E, Young KH, Bertoni F. Testoni M, et al. Ann Oncol. 2015 Jun;26(6):1069-1080. doi: 10.1093/annonc/mdv019. Epub 2015 Jan 20. Ann Oncol. 2015. PMID: 25605746 Free PMC article. Review.
References
- Barth, T.F., F. Leithauser, S. Joos, M. Bentz, and P. Moller. 2002. Mediastinal (thymic) large B-cell lymphoma: where do we stand? Lancet Oncol. 3:229–234. - PubMed
- Bishop, P.C., W.H. Wilson, D. Pearson, J. Janik, E.S. Jaffe, and P.C. Elwood. 1999. CNS involvement in primary mediastinal large B-cell lymphoma. J. Clin. Oncol. 17:2479–2485. - PubMed
- Alizadeh, A.A., M.B. Eisen, R.E. Davis, C. Ma, I.S. Lossos, A. Rosenwald, J.C. Boldrick, H. Sabet, T. Tran, X. Yu, et al. 2000. Distinct types of diffuse large B-cell lymphoma identified by gene expression profiling. Nature. 403:503–511. - PubMed
- Rosenwald, A., G. Wright, W.C. Chan, J.M. Connors, E. Campo, R.I. Fisher, R.D. Gascoyne, H.K. Muller-Hermelink, E.B. Smeland, J.M. Giltnane, et al. 2002. The use of molecular profiling to predict survival after chemotherapy for diffuse large-B-cell lymphoma. N. Engl. J. Med. 346:1937–1947. - PubMed
Publication types
MeSH terms
LinkOut - more resources
Full Text Sources
Other Literature Sources
Medical
Research Materials


