Gating of MscL studied by steered molecular dynamics - PubMed (original) (raw)
Comparative Study
Gating of MscL studied by steered molecular dynamics
Justin Gullingsrud et al. Biophys J. 2003 Oct.
Abstract
Steered molecular dynamics simulations of the mechanosensitive channel of large conductance, MscL, were used to investigate how forces arising from membrane tension induce gating of the channel. A homology model of the closed form of MscL from Escherichia coli was subjected to external forces of 35-70 pN applied to residues near the membrane-water interface. The magnitude and location of these forces corresponded to those determined from the lateral pressure profile computed from a lipid bilayer simulation. A fully expanded state was obtained on the 10-ns timescale that revealed the mechanism for transducing membrane forces into channel opening. The expanded state agrees well with proposed models of MscL gating, in that it entails an irislike expansion of the pore accompanied by tilting of the transmembrane helices. The channel was most easily opened when force was applied predominantly on the cytoplasmic side of MscL. Comparison of simulations in which gating progressed to varying degrees identified residues that pose steric hindrance to channel opening.
Figures
FIGURE 1
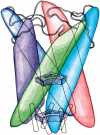
Homopentameric architecture of MscL. Five inner and five outer transmembrane helices assemble in pairs, each pair being comprised of helices from neighboring subunits. The inner (M1) helices form a water-tight constriction within the membrane, represented as the upper gate. Each M1 helix forms extensive contacts with an outer helix (M2) from a neighboring subunit; these helix pairs are sketched as solid-colored structures. In the model of reference (Sukharev et al., 2001a), the N-terminal domains (S1) form a helix bundle which comprises a second gate, shown schematically at the bottom of the drawing.
FIGURE 2
Starting Eco-MscL structure used in simulations. (Pink) S1 helices and linker region (residues 1–14); (blue) M1 helices (residues 15–45); (orange) periplasmic loops (residues 46–75); (red) M2 helices (residues 76–100); and (green) C-terminus (residues 101–110). Shown in blow-up are regions of the periplasmic loops and the N- and C-termini subjected to additional modeling described in the text. Side-chain orientations as modeled by Sukharev et al. (2001b) are rendered transparently; the orientations after modeling and minimization are shown in solid colors.
FIGURE 3
Pressure profile of a DLPE membrane. The graph (left) shows the difference between the lateral pressure and the normal pressure as a function of depth in the membrane. Data was collected from a 9-ns simulation and sorted into 60 bins of thickness 1 Å; the statistical error in the data shown is 15–30 bar. (Middle) Snapshot from the DLPE simulation with atoms colored according to the pressure at their position, blue corresponding to negative lateral pressure and red to positive lateral pressure. (Right) The identical simulation snapshot, rendered to highlight structural components of the membrane; red spheres correspond to the ester oxygens connecting the lipid tails to the headgroup. Note that the strongest lateral pressure difference arises near the lipid-water interface.
FIGURE 4
(a) Top view and (b) side view of forces applied to MscL during simulations C6, C7, and O1–O4. Red-colored residues are _Val_17 and _Leu_36.
FIGURE 5
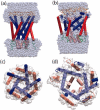
Snapshots from simulation O4 at 0 ns, a and c; and 10 ns, b and d. In a and b, water is shown in space-filling representation; in c and d, the MSMS-calculated surface (Sanner et al., 1995) of the channel formed by residues 15–41 and 77–100 is shown. MscL is represented in each snapshot as cartoon, with secondary structure calculated using STRIDE (Frishman and Argos, 1995) from the coordinates at 0 and 10 ns.
FIGURE 6
Change in average radius of C_α_ atoms during SMD simulations. (a) Change in radius relative to t = 0 during simulations C6 and O1. C6 at 6 ns (dotted line); C7 at 10 ns (dashed line); O1 at 6 ns (thick solid line); and O1 at 10 ns (thin solid line). (b) Change in average radius of C_α_ atom by residue during simulations O1–O4. O1 at 10.6 ns (thick solid line); O2 at 4.45 ns (crosses); O3 at 5 ns (circles); and O4 at 10 ns (thin solid line). (c) Schematic MscL gating mechanism explaining results of simulations O1–O4. only Sl, M1, and loop sections are shown. The labeled radii at the cytoplasmic and periplasmic ends correspond to average C_α_ radii in the respective protein regions from simulation O1.
FIGURE 7
(Top row, left to right) Ramachandran trajectory for residues _Arg_13, _Gly_14, and _Asn_15 for one representative subunit during simulation O1. (Bottom row) Structure of Sl helices during simulation O1 in cartoon representation. (From left to right) 0 ns, 3 ns, 7 ns, and 10 ns. The transition from left-handed to right-handed crossing is evident in the red-blue helix pair.
FIGURE 8
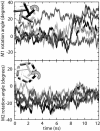
Internal rotation of (top) M1 and (bottom) M2 helices in simulation O4. Data from each of the five subunits are shown. Data shown are a 100-ps running average of the angles calculated every 10 ps.
FIGURE 9
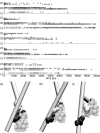
Interaction of _Gly_22 (asterisks) and _Gly_26 (circles) with residues in neighboring subunits in simulation O1. The graphs show which residues had atoms within 2.5 A of _Gly_22 or _Gly_26 during the simulation; the sampling period was 50 ps. (Below) Relative orientation of M1 helices in simulation O1 at (a) 0 ns, (b) 2 ns, and (c) 8 ns. _Gly_22 is shaded dark, _Gly_26 is shaded medium, and residues _Val_16, _Leu_19, and _Ala_20 are shaded light.
FIGURE 10
Interaction of _Ala_20 with residues in neighboring subunits during (a) simulation C6 and (b) simulation O1. Each row corresponds to one subunit. The vertical axis of each graph corresponds to the residue IDs of residues interacting with the Ala residue of the neighboring subunit. The relative orientation of neighboring subunits in this figure is the opposite of that in Fig. 9. Below, snapshots from one representative subunit pair showing the relative orientation of _Ala_20 (light) with _Ile_25 (medium), and _Phe_29 (dark).
FIGURE 11
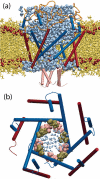
MscL-DLPE structure at the conclusion of the 14.2-ns explicit membrane simulation. (a) MscL cross-section, showing water penetration in the pore. Lipid atoms are colored yellow; ester oxygen atoms marking the edge of the hydrophobic core of the bilayer are shown as red spheres. M1 (blue) and M2 (red) helices are shown in cartoon representation. (b) MscL pore, with residues _Leu_19 (pink) and _Val_23 (tan) forming the transmembrane pore constriction. Water molecules found in the pore are shown in blue to indicate the relative size of the pore.
Similar articles
- Mechanosensitive membrane channels in action.
Yefimov S, van der Giessen E, Onck PR, Marrink SJ. Yefimov S, et al. Biophys J. 2008 Apr 15;94(8):2994-3002. doi: 10.1529/biophysj.107.119966. Epub 2008 Jan 11. Biophys J. 2008. PMID: 18192351 Free PMC article. - Membrane-protein interactions in mechanosensitive channels.
Wiggins P, Phillips R. Wiggins P, et al. Biophys J. 2005 Feb;88(2):880-902. doi: 10.1529/biophysj.104.047431. Epub 2004 Nov 12. Biophys J. 2005. PMID: 15542561 Free PMC article. - A finite element framework for studying the mechanical response of macromolecules: application to the gating of the mechanosensitive channel MscL.
Tang Y, Cao G, Chen X, Yoo J, Yethiraj A, Cui Q. Tang Y, et al. Biophys J. 2006 Aug 15;91(4):1248-63. doi: 10.1529/biophysj.106.085985. Epub 2006 May 26. Biophys J. 2006. PMID: 16731564 Free PMC article. - MscL: channeling membrane tension.
Walton TA, Idigo CA, Herrera N, Rees DC. Walton TA, et al. Pflugers Arch. 2015 Jan;467(1):15-25. doi: 10.1007/s00424-014-1535-x. Epub 2014 May 27. Pflugers Arch. 2015. PMID: 24859800 Free PMC article. Review. - Mechanosensitive channels: insights from continuum-based simulations.
Tang Y, Yoo J, Yethiraj A, Cui Q, Chen X. Tang Y, et al. Cell Biochem Biophys. 2008;52(1):1-18. doi: 10.1007/s12013-008-9024-5. Epub 2008 Sep 12. Cell Biochem Biophys. 2008. PMID: 18787764 Free PMC article. Review.
Cited by
- Three-dimensional stress field around a membrane protein: atomistic and coarse-grained simulation analysis of gramicidin A.
Yoo J, Cui Q. Yoo J, et al. Biophys J. 2013 Jan 8;104(1):117-27. doi: 10.1016/j.bpj.2012.11.3812. Epub 2013 Jan 8. Biophys J. 2013. PMID: 23332064 Free PMC article. - The gating mechanism of the bacterial mechanosensitive channel MscL revealed by molecular dynamics simulations: from tension sensing to channel opening.
Sawada Y, Murase M, Sokabe M. Sawada Y, et al. Channels (Austin). 2012 Jul-Aug;6(4):317-31. doi: 10.4161/chan.21895. Channels (Austin). 2012. PMID: 23146938 Free PMC article. - Gating mechanisms of mechanosensitive channels of large conductance, II: systematic study of conformational transitions.
Tang Y, Yoo J, Yethiraj A, Cui Q, Chen X. Tang Y, et al. Biophys J. 2008 Jul;95(2):581-96. doi: 10.1529/biophysj.107.128496. Epub 2008 Apr 4. Biophys J. 2008. PMID: 18390625 Free PMC article. - Asymmetric Nature of MscL Opening Revealed by Molecular Dynamics Simulations.
Rogacheva ON, Kopec W. Rogacheva ON, et al. J Chem Inf Model. 2025 Jun 23;65(12):6129-6143. doi: 10.1021/acs.jcim.5c00307. Epub 2025 Jun 5. J Chem Inf Model. 2025. PMID: 40471653 Free PMC article. - The role of MscL amphipathic N terminus indicates a blueprint for bilayer-mediated gating of mechanosensitive channels.
Bavi N, Cortes DM, Cox CD, Rohde PR, Liu W, Deitmer JW, Bavi O, Strop P, Hill AP, Rees D, Corry B, Perozo E, Martinac B. Bavi N, et al. Nat Commun. 2016 Jun 22;7:11984. doi: 10.1038/ncomms11984. Nat Commun. 2016. PMID: 27329693 Free PMC article.
References
- Ajouz, B., C. Berrier, M. Besnard, B. Martinac, and A. Ghazi. 2000. Contributions of the different extramembranous domains of the mechanosensitive ion channel MscL to its response to membrane tension. J. BioI. Chem. 275:1015–1022. - PubMed
- Bass, R. B., P. Strop, M. Barclay, and D. C. Rees. 2002. Crystal structure of Escherichia coli MscS, a voltage-modulated and mechanosensitive channel. Science. 298:1582–1587. - PubMed
- Blount, P., M. J. Schroeder, and C. Kung. 1997. Mutations in a bacterial mechanosensitive channel change the cellular response to osmotic stress. J. BioI. Chem. 272:32150–32157. - PubMed
Publication types
MeSH terms
Substances
LinkOut - more resources
Full Text Sources
Molecular Biology Databases
Miscellaneous
