Optical microwell assay of membrane transport kinetics - PubMed (original) (raw)
Comparative Study
Optical microwell assay of membrane transport kinetics
Nikolai I Kiskin et al. Biophys J. 2003 Oct.
Abstract
In optical single transporter recording, membranes are firmly attached to flat solid substrates containing small wells or test compartments (TC). Transport of fluorescent molecules through TC-spanning membrane patches is induced by solution change and recorded by confocal microscopy. Previously, track-etched membrane filters were used to create solid substrates containing populations of randomly distributed TCs. In this study the possibilities offered by orderly TC arrays as created by laser microdrilling were explored. A theoretical framework was developed taking the convolution of membrane transport, solution change, and diffusion into account. The optical properties of orderly TC arrays were studied and the kinetics of solution change measured. Export and import through the nuclear pore complex (NPC) was analyzed in isolated envelopes of Xenopus oocyte nuclei. In accordance with previous reports nuclear transport receptor NTF2, which binds directly to NPC proteins, was found to be translocated much faster than "inert" molecules of similar size. Unexpectedly, NXT1, a homolog of NTF2 reportedly unable to bind to NPC proteins directly, was translocated as fast as NTF2. Thus, microstructured TC arrays were shown to provide optical single transporter recording with a new basis.
Figures
FIGURE 1
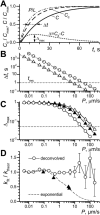
Refined theoretical description of OSTR experiments. (A) Example of calculated substrate concentration kinetics. Length of test compartment, L = 50 _μ_m; observation at x = 30 _μ_m; concentration in the chamber changed instantaneously from 0 to _C_max at t = 0. Curve P/L (dash-dot line): pure permeation or membrane transport (_D_→∞, P = 5 _μ_m/s; calculated according to Eq. 6 for k = P/L = 0.1 s−1). Curve _C_d (dashed line): pure diffusion (diffusion coefficient D = 80 _μ_m2/s, permeability coefficient _P_→∞). Curve C (solid line): convolution of membrane transport and diffusion (D = 80 _μ_m2/s, P = 5 μ_m/s). Horizontal arrows: difference between halftimes of permeation and diffusion Δ_t; vertical arrows: Δmax, the maximum of the difference Δ = C − C_d (dotted line). (B) Dependence of Δ_t (see A) on P for TCs of 50-_μ_m length (○) and 10-_μ_m length (▵). Dashed lines represent function ln(2)L/P. Horizontal dashed line indicates an experimental time resolution _t_res = 1 s. (C) Dependence of Δmax (see A) on P for TCs of 50-_μ_m length (○) and 10-_μ_m length (▴, ▵). A level of 5% amplitude resolution is indicated by the dashed line. Solid triangles show data for diffusion and permeation curves in 10 μ_m TC both convolved with idealized exponential solution exchange 1–exp(−_k_s_t), _k_s = 1 s−1. (D) From pairs of curves simulated with _k_theor = P/L (see text) the membrane transport rate constants _k_fit were recovered either by deconvolution (○) or by a simple exponential fit (dashed line). Experimentally obtained ratios of _k_-values for exponential and deconvolution fits are plotted for each transport substrate by solid triangles (data from Table 1).
FIGURE 2
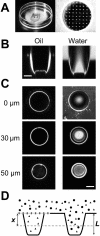
Optical properties of microstructured test compartments. (A) OSTR chamber with attached TC array. (B) Vertical confocal scan through TCs filled with immersion oil, 40-fold 1.0 NA objective (left) or a 4-_μ_M aqueous solution of Alexa488-NTF2, 16-fold 0.5 NA objective (right). (C) Horizontal confocal scans of the TCs shown in B. Vertical positions of the scans as indicated. Scale bars: 30 _μ_m. (D) Schematic drawing of arrangement in transport measurements (cf. Fig. 4). Two TCs are shown, one covered by a membrane (measuring TC), the other without membrane (reference TC). The transport substrate (triangles) is able to permeate the membrane and thus to fill both the measuring and the reference TC. The control substance (circles) cannot permeate the membrane and is therefore found only in the reference TC. The fluorescence is sampled (dashed line) at a depth of x = 30 _μ_m (i.e., x/L = 0.6), which is optimal for measurements inside TCs.
FIGURE 3
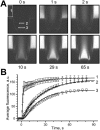
Solution change kinetics and diffusion: experiment and theory. At t = 0, a solution containing 4 _μ_M GFP and 100 mM sucrose was injected into a buffer-filled OSTR chamber. A series of vertical confocal 125 × 125 _μ_m scans was acquired, employing the time lapse program of the microscope. (A) Examples of the image series at indicated times. White rectangles show regions where fluorescence was quantified. (B) Quantification and fit. Experimental data (symbols, average of six measurements, bars indicate SE) were derived from image series shown in A. Curve 1 represents best fit to solution change kinetics at the surface of the TC (box 1) yielding (in fluorescence units) _C_0 = 0, _C_1 = 134, _C_2 = 32.9, _τ_1 = 0.870 s, _τ_2 = 19.4 s, _dt_1 = 0.788 s, _dt_2 = 7.59 s in Eq. 18. Curve 2 represents best fit to experimental concentration change in area 2 (x = 30 _μ_m) at different conditions: solid line: unconstrained fit was obtained with _τ_D = 53.4 s, x/L = 0.48, and ratio of amplitude to the amplitude of curve 1 equals 0.97; dashed line: fit with fixed x/L = 0.6 yielded _τ_D = 39.6 s and amplitude ratio 0.92. Curve 3 shows fit to experimental concentration change at the TC bottom (x = 50 _μ_m) giving _τ_D = 34.1 s and amplitude ratio 0.70.
FIGURE 4
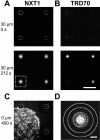
Measurement of NXT1 translocation through the NPC. In an OSTR chamber a Xenopus oocyte nuclear envelope was attached to a TC array. A region of the TC array was imaged containing one membrane-covered TC (measuring TC) and three noncovered TCs (reference TCs). (A,B) Transport was initiated by injecting a transport solution (2 _μ_M Alexa488-NXT1, 3 _μ_M TRD70, 100 mM sucrose) into the chamber at t = 0. A series of horizontal confocal scans, monitoring in parallel the green Alexa488-NXT1, A, and the red TRD70 fluorescence, B, was acquired at a depth of x = 30 _μ_m below the array surface. NXT1 appeared quickly in both measuring and reference TCs, TRD70 only in reference TCs. Scale bar: 200 _μ_m. (C) After completion of transport the focus was shifted to the array surface disclosing that NXT1 binds to the nuclear envelope. (D) Insert from A showing regions of interest selected for the measurements of TC fluorescence (inner circle) and background (ring between two outer circles). Scale bar: 30 _μ_m.
FIGURE 5
Export and import kinetics of NXT1. Translocation of NXT1 through the nuclear pore complex was measured as illustrated in Fig. 4. (A) Export. At the top, selected examples from a representative image series are given, placing a measuring TC and a reference TC (Ref) of channel 1 (Alexa488-NXT1 fluorescence) side by side (montage of parts of scans as shown in Fig. 4 A). At the bottom, the background-corrected change in fluorescence is given for the measuring TC (triangles) and the averaged reference TCs (circles). The fluorescence of reference TCs was fitted by Eq. 18 and that of the measuring TC by Eqs. 16 and 17 yielding k = 0.0446 s−1 and an amplitude ratio of 0.981 (lines). Stars show the residues of this fit. (B) Import. Symbols and lines analogous to export. The best fit yielded k = 0.0595 s−1 and an amplitude ratio of 1.05.
FIGURE 6
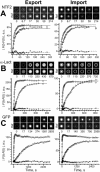
Export and import kinetics of NTF2, _α_-lact and GFP. Presentation as in Fig. 5. Best fits yielded (A) k = 0.117 s−1, amplitude ratio A = 0.911 (NTF2 export), k = 0.0613 s−1, A = 0.931 (NTF2 import); (B) k = 6.96 × 10⁻³ s−1, A = 0.913 (_α_-lact export), k = 4.46 × 10⁻³ s−1, A = 1.09 (_α_-lact import); (C) k = 8.79 × 10⁻⁴ s−1, A = 0.911 (GFP export), k = 1.86 × 10⁻³ s−1, A = 0.832 (GFP import). Note the different timescales.
Similar articles
- Optical single transporter recording: transport kinetics in microarrays of membrane patches.
Peters R. Peters R. Annu Rev Biophys Biomol Struct. 2003;32:47-67. doi: 10.1146/annurev.biophys.32.110601.142429. Epub 2003 Feb 6. Annu Rev Biophys Biomol Struct. 2003. PMID: 12574067 Review. - Rapid translocation of NTF2 through the nuclear pore of isolated nuclei and nuclear envelopes.
Siebrasse JP, Peters R. Siebrasse JP, et al. EMBO Rep. 2002 Sep;3(9):887-92. doi: 10.1093/embo-reports/kvf171. Epub 2002 Aug 16. EMBO Rep. 2002. PMID: 12189172 Free PMC article. - Use of Xenopus laevis oocyte nuclei and nuclear envelopes in nucleocytoplasmic transport studies.
Peters R. Peters R. Methods Mol Biol. 2006;322:259-72. doi: 10.1007/978-1-59745-000-3_18. Methods Mol Biol. 2006. PMID: 16739729 Review. - Optical recording of signal-mediated protein transport through single nuclear pore complexes.
Keminer O, Siebrasse JP, Zerf K, Peters R. Keminer O, et al. Proc Natl Acad Sci U S A. 1999 Oct 12;96(21):11842-7. doi: 10.1073/pnas.96.21.11842. Proc Natl Acad Sci U S A. 1999. PMID: 10518538 Free PMC article. - Nuclear transport kinetics in microarrays of nuclear envelope patches.
Peters R, Coutavas E, Siebrasse JP. Peters R, et al. J Struct Biol. 2002 Oct-Dec;140(1-3):268-78. doi: 10.1016/s1047-8477(02)00525-7. J Struct Biol. 2002. PMID: 12490174 Review.
Cited by
- Characterization of cell-to-cell variation in nuclear transport rates and identification of its sources.
Durrieu L, Bush A, Grande A, Johansson R, Janzén D, Katz A, Cedersund G, Colman-Lerner A. Durrieu L, et al. iScience. 2022 Dec 29;26(1):105906. doi: 10.1016/j.isci.2022.105906. eCollection 2023 Jan 20. iScience. 2022. PMID: 36686393 Free PMC article. - Simple rules for passive diffusion through the nuclear pore complex.
Timney BL, Raveh B, Mironska R, Trivedi JM, Kim SJ, Russel D, Wente SR, Sali A, Rout MP. Timney BL, et al. J Cell Biol. 2016 Oct 10;215(1):57-76. doi: 10.1083/jcb.201601004. Epub 2016 Oct 3. J Cell Biol. 2016. PMID: 27697925 Free PMC article. - Nuclear transport of single molecules: dwell times at the nuclear pore complex.
Kubitscheck U, Grünwald D, Hoekstra A, Rohleder D, Kues T, Siebrasse JP, Peters R. Kubitscheck U, et al. J Cell Biol. 2005 Jan 17;168(2):233-43. doi: 10.1083/jcb.200411005. J Cell Biol. 2005. PMID: 15657394 Free PMC article. - Nanopore unitary permeability measured by electrochemical and optical single transporter recording.
Hemmler R, Böse G, Wagner R, Peters R. Hemmler R, et al. Biophys J. 2005 Jun;88(6):4000-7. doi: 10.1529/biophysj.104.058255. Epub 2005 Mar 4. Biophys J. 2005. PMID: 15749773 Free PMC article. - Design principles of selective transport through biopolymer barriers.
Maguire L, Stefferson M, Betterton MD, Hough LE. Maguire L, et al. Phys Rev E. 2019 Oct;100(4-1):042414. doi: 10.1103/PhysRevE.100.042414. Phys Rev E. 2019. PMID: 31770897 Free PMC article.
References
- Adamson, R. H., V. H. Huxley, and F. E. Curry. 1988. Single capillary permeability to proteins having similar size but different charge. Am. J. Physiol. Heart Circ. Physiol. 254:H304–H312. - PubMed
- Allen, T. D., J. M. Cronshaw, S. Bagley, E. Kiseleva, and M. W. Goldberg. 2000. The nuclear pore complex: mediator of translocation between nucleus and cytoplasm. J. Cell Sci. 113:1651–1659. - PubMed
Publication types
MeSH terms
Substances
LinkOut - more resources
Full Text Sources
Other Literature Sources
