Differential role of p300 and CBP acetyltransferase during myogenesis: p300 acts upstream of MyoD and Myf5 - PubMed (original) (raw)
Differential role of p300 and CBP acetyltransferase during myogenesis: p300 acts upstream of MyoD and Myf5
Jeanne-Françoise Roth et al. EMBO J. 2003.
Abstract
Studies in tissue culture cells have implicated p300 and CBP acetyltransferases in myogenic regulatory factor (MRF) mediated transcription and terminal differentiation of skeletal muscle cells. However, in vivo data placing p300 and CBP on myogenic differentiation pathways are not yet available. In this report we provide genetic evidence that p300 but not CBP acetyltransferase (AT) activity is required for myogenesis in the mouse and in embryonic stem (ES) cells. A fraction of embryos carrying a single p300 AT- deficient allele exhibit impaired MRF expression, delayed terminal differentiation and a reduced muscle mass. In mouse embryos lacking p300 protein, Myf-5 induction is severely attenuated. Similarly, ES cells homozygous for a p300 AT or a p300 null mutation fail to activate Myf5 and MyoD transcription efficiently, while Pax3, acting genetically upstream of these MRFs, is expressed. In contrast, ES cells lacking CBP AT activity express MyoD and Myf5 and undergo myogenic differentiation. These data reveal a specific requirement for p300 and its AT activity in the induction of MRF gene expression and myogenic cell fate determination in vivo.
Figures
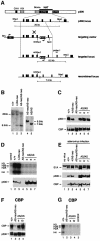
Fig. 1. Targeting strategy to generate p300 AT mutant ES cells and characterization of p300 or CBP AT-mutant ES cells. (A) Overall organization of the p300 protein, the wild-type p300 genomic locus, the targeting vector and the recombined loci is shown. The asterisks indicate the site of the mutation, which harbors a _de novo Nhe_I restriction site. (B) Southern blot with probe 1 analysing genomic DNA isolated from wild-type, heterozygous (p300+/AS-neo) and homozygous p300 KO (_p300_AS-neo/AS-neo) and p300 AT– (_p300_AS/AS) ES cells. The probes and the size of the genomic DNA fragments following _Nhe_I restriction digest are indicated in (A). (C and F) Western blot analysis showing p300 and CBP protein levels in (C) p300 KO and p300 AT– cells and (F) CBP KO (_cbp_AS-neo/AS-neo) and CBP AT– (_cbp_AS/AS) cells. (E) E1A binding assay: western blot analysis following E1A immunoprecipitation from ES cells infected with adenovirus using, from top to bottom, E1A, p300 or CBP antibodies. (D and G) HAT assay with (D) p300 KO and three independent p300 AT– cell lines and (G) CBP KO and two independent CBP AT– cell lines.
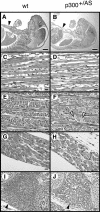
Fig. 2. Histological analysis of E18.5 wild-type and p300+/AS mouse embryos. HE staining of sagittal (A–D) or transverse (E and F) mouse sections. An overview of the embryos is shown in (A) and (B); black arrows point to the body wall. Enlarged views of the trapezius muscle (C and D), the tongue (E and F), the diaphragm (G and H) and the intercostal muscles (I and J). Scale bars: (A and B), 2 mm; (C–H), 100 µm; (I and J) 500 µm. White arrowheads mark muscle fibers in the trapezius (C and D) and loose muscle fibers in the tongue (F). Black arrowheads indicate the intercostal muscle located between the second and third sternebra (I and J).
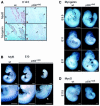
Fig. 3. Skeletal muscle structural protein expression in mouse embryos. (A) Transverse sections of wild-type (wt) and p300+/AS littermates aged E14.5 stained with HE (a and b) and with a sacromeric actin antibody (c–f). Enlarged view (20×) of the paravertebral area: arrowheads indicate the edema (a and b) and the back muscle mass (c and d). Enlarged view (40×) of the tongue (e and f); arrowheads highlight actin staining. (B) Transverse section of wild-type and cbp+/AS mice aged E14.5 stained with HE (a and b) and enlarged view (20×) of the paravertebral region following sarcomeric actin staining (c and d). (C) Myosin heavy-chain whole-mount immunostaining of E10.5 wild-type and p300+/AS littermates using MF20. Scale bar, 500 µm. Filled arrowheads indicate staining in the posterior region of the wild-type embryo which is absent in the p300+/AS littermate.
Fig. 4. MRF expression in mouse embryos. (A) MRF expression in the paravertebral region of E14.5 wild-type and p300+/AS embryos. MyoD (a and b) and myogenin (c and d) immunostaining. S, spinal chord; arrowheads indicate the muscle groups. (B–D) Whole-mount in situ hybridization of wild-type and p300+/AS littermate embryos aged between E9.5 and E11.5 showing (B) Myf5, (C) myogenin and (D) MyoD expression. The arrowhead in (B) highlights a disruption of the Myf5 expression pattern. Scale bars, 500 µm.
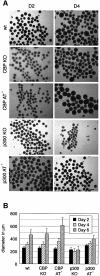
Fig. 5. Formation and proliferation of embryoid bodies. Wild-type E14, CBP KO, CBP AT–, p300 KO and p300 AT– ES cell lines were aggregated as hanging drops for 2 days to form EBs and transferred to bacterial dishes. (A) Microscope analysis of EBs at D2 and D4. The bar represents 400 µm. (B) Histogram representing the diameter of EBs derived from all five cell lines at D2, D4 and D6 of differentiation. The standard deviation represents the average of three independent experiments. Fifty EBs were measured per cell line at each time point.
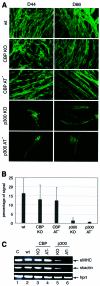
Fig. 6. Skeletal muscle formation during in vitro ES cell differentiation. The ES cell lines used were E14 wild type, CBP KO, CBP AT–, p300 KO and p300 AT–. (A) MHC expression at D44 or D66 of differentiation was determined by immunofluorescence. (B) The signal was quantified at D44 using the Adobe quantification toolpack™. The standard deviation is derived from the results of three independent experiments. (C) RT–PCR showing embryonic myosin heavy chain (eMHC) and skeletal actin (skactin) expression at D44. Hprt was used as an internal control. Lane 1, positive control with total RNA from an E11.5 embryo.
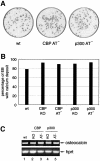
Fig. 7. In vitro osteogenesis. The ES cell lines used were E14, CBP KO, CBP AT–, p300 KO and p300 AT–. (A) Bone mineral deposition in EBs is indicative of osteogenesis and was visualized by alizarin red staining at D20. (B) Bar diagram illustrating the percentage of EBs containing calcium deposits. (C) Osteocalcin and Hprt expression analysed by RT–PCR of 150 EBs at D20 of osteogenesis.
Fig. 8. Expression of myogenic regulatory factors in differentiated EBs. RNA expression levels of the indicated genes were determined by RT–PCR at D23 (lanes 2–6) and D44 (lanes 7–11). Lane 1, positive control using RNA from E10.5–E13.5 embryos. The ES cell lines used were E14 wild type (lanes 2 and 7), CBP KO (lanes 3 and 8), CBP AT– (lanes 4 and 9), p300 KO (lanes 5 and 10) and p300 AT– (lanes 6 and 11).
Fig. 9. Myf5 expression in E8.5 p300+/– and _p300_–/– littermates detected by whole-mount in situ hybridization. Arrowheads indicate the somites expressing Myf5. Scale bars, 500 µm.
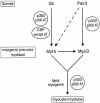
Fig. 10. Model placing p300, CBP and their respective AT activities on genetic pathways controlling skeletal myogenesis. Arrows represent an established link. Dashed arrows represent a suggested effect. Note that arrows do not necessarily reflect a direct effect.
Similar articles
- Molecular mechanisms of myogenic coactivation by p300: direct interaction with the activation domain of MyoD and with the MADS box of MEF2C.
Sartorelli V, Huang J, Hamamori Y, Kedes L. Sartorelli V, et al. Mol Cell Biol. 1997 Feb;17(2):1010-26. doi: 10.1128/MCB.17.2.1010. Mol Cell Biol. 1997. PMID: 9001254 Free PMC article. - Interaction between acetylated MyoD and the bromodomain of CBP and/or p300.
Polesskaya A, Naguibneva I, Duquet A, Bengal E, Robin P, Harel-Bellan A. Polesskaya A, et al. Mol Cell Biol. 2001 Aug;21(16):5312-20. doi: 10.1128/MCB.21.16.5312-5320.2001. Mol Cell Biol. 2001. PMID: 11463815 Free PMC article. - Acetylation regulates the differentiation-specific functions of the retinoblastoma protein.
Nguyen DX, Baglia LA, Huang SM, Baker CM, McCance DJ. Nguyen DX, et al. EMBO J. 2004 Apr 7;23(7):1609-18. doi: 10.1038/sj.emboj.7600176. Epub 2004 Mar 25. EMBO J. 2004. PMID: 15044952 Free PMC article. - CBP and p300: HATs for different occasions.
Kalkhoven E. Kalkhoven E. Biochem Pharmacol. 2004 Sep 15;68(6):1145-55. doi: 10.1016/j.bcp.2004.03.045. Biochem Pharmacol. 2004. PMID: 15313412 Review. - p300/CBP and cancer.
Iyer NG, Ozdag H, Caldas C. Iyer NG, et al. Oncogene. 2004 May 24;23(24):4225-31. doi: 10.1038/sj.onc.1207118. Oncogene. 2004. PMID: 15156177 Review.
Cited by
- Taking the road less traveled - the therapeutic potential of CBP/β-catenin antagonists.
Kahn M. Kahn M. Expert Opin Ther Targets. 2021 Sep;25(9):701-719. doi: 10.1080/14728222.2021.1992386. Epub 2021 Oct 27. Expert Opin Ther Targets. 2021. PMID: 34633266 Free PMC article. Review. - Developmental programming of fetal skeletal muscle and adipose tissue development.
Yan X, Zhu MJ, Dodson MV, Du M. Yan X, et al. J Genomics. 2013 Nov 8;1:29-38. doi: 10.7150/jgen.3930. eCollection 2013. J Genomics. 2013. PMID: 25031653 Free PMC article. Review. - Modified halloysite nanotubes reduce the toxic effects of zearalenone in gestating sows on growth and muscle development of their offsprings.
Gao R, Meng Q, Li J, Liu M, Zhang Y, Bi C, Shan A. Gao R, et al. J Anim Sci Biotechnol. 2016 Feb 29;7:14. doi: 10.1186/s40104-016-0071-2. eCollection 2016. J Anim Sci Biotechnol. 2016. PMID: 26933493 Free PMC article. - Wnt/catenin signaling in adult stem cell physiology and disease.
Ring A, Kim YM, Kahn M. Ring A, et al. Stem Cell Rev Rep. 2014 Aug;10(4):512-25. doi: 10.1007/s12015-014-9515-2. Stem Cell Rev Rep. 2014. PMID: 24825509 Free PMC article. Review. - Spatiotemporal expression of histone acetyltransferases, p300 and CBP, in developing embryonic hearts.
Chen G, Zhu J, Lv T, Wu G, Sun H, Huang X, Tian J. Chen G, et al. J Biomed Sci. 2009 Feb 23;16(1):24. doi: 10.1186/1423-0127-16-24. J Biomed Sci. 2009. PMID: 19272189 Free PMC article.
References
- Akimaru H., Hou,D.X. and Ishii,S. (1997) Drosophila CBP is required for dorsal-dependent twist gene expression. Nat. Genet., 17, 211–214. - PubMed
- Arnold H.H. and Winter,B. (1998) Muscle differentiation: more complexity to the network of myogenic regulators. Curr. Opin. Genet. Dev., 8, 539–544. - PubMed
- Bailey P., Holowacz,T. and Lassar,A.B. (2001) The origin of skeletal muscle stem cells in the embryo and the adult. Curr. Opin. Cell Biol., 13, 679–689. - PubMed
- Bannister A.J. and Kouzarides,T. (1996) The CBP co-activator is a histone acetyltransferase. Nature, 384, 641–643. - PubMed
- Bober E., Franz,T., Arnold,H.H., Gruss,P. and Tremblay,P. (1994) Pax-3 is required for the development of limb muscles: a possible role for the migration of dermomyotomal muscle progenitor cells. Development, 120, 603–612. - PubMed
Publication types
MeSH terms
Substances
LinkOut - more resources
Full Text Sources
Other Literature Sources
Molecular Biology Databases
Miscellaneous
