RNAi microarray analysis in cultured mammalian cells - PubMed (original) (raw)
. 2003 Oct;13(10):2341-7.
doi: 10.1101/gr.1478703.
Natasha J Caplen, Robert Cornelison, Don Weaver, Mark Basik, Sampsa Hautaniemi, Abdel G Elkahloun, Roberto A Lotufo, Ashish Choudary, Edward R Dougherty, Ed Suh, Olli Kallioniemi
Affiliations
- PMID: 14525932
- PMCID: PMC403721
- DOI: 10.1101/gr.1478703
RNAi microarray analysis in cultured mammalian cells
Spyro Mousses et al. Genome Res. 2003 Oct.
Abstract
RNA interference (RNAi) mediated by small interfering RNAs (siRNAs) is a powerful new tool for analyzing gene knockdown phenotypes in living mammalian cells. To facilitate large-scale, high-throughput functional genomics studies using RNAi, we have developed a microarray-based technology for highly parallel analysis. Specifically, siRNAs in a transfection matrix were first arrayed on glass slides, overlaid with a monolayer of adherent cells, incubated to allow reverse transfection, and assessed for the effects of gene silencing by digital image analysis at a single cell level. Validation experiments with HeLa cells stably expressing GFP showed spatially confined, sequence-specific, time- and dose-dependent inhibition of green fluorescence for those cells growing directly on microspots containing siRNA targeting the GFP sequence. Microarray-based siRNA transfections analyzed with a custom-made quantitative image analysis system produced results that were identical to those from traditional well-based transfection, quantified by flow cytometry. Finally, to integrate experimental details, image analysis, data display, and data archiving, we developed a prototype information management system for high-throughput cell-based analyses. In summary, this RNAi microarray platform, together with ongoing efforts to develop large-scale human siRNA libraries, should facilitate genomic-scale cell-based analyses of gene function.
Figures
Figure 1
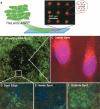
The RNAi microarray platform. (A) HeLa cells expressing a destabilized version of eGFP (HeLa/d2eGFP) cells were plated on slides arrayed with an e_gfp_ siRNA (2.5 ng) tagged with fluorescent rhodamine (rh-egfp). HeLa/d2eGFP cells grown on an rh-egfp siRNA microarray slide for 72 h were fixed with 2% paraformaldehyde and counterstained with DAPI. (B) An rh-egfp spot (2.5 ng siRNA) showing the localized inhibition of green fluorescence (25×, green channel only). (C) The uptake of rh-egfp siRNA-lipoplexes showing cellular accumulation of the siRNA in silenced cells (1000×). (D) A clear edge to the arrayed rh-egfp siRNA spot was present only in the green channel (200×, overlaid green and blue images), with (E) inhibition of eGFP fluorescence occurring within the spot (400×, overlaid green and blue images). (F) No inhibition of eGFP fluorescence in cells was observed around the rh-egfp siRNA spot (400×, overlaid green and blue images).
Figure 2
The entity relationship diagram shows the relational model applied to tracking data on individual experiments. The fields and their relationships for the various levels of information are shown by connecting lines. System users are able to load, retrieve, and update experiment information in the database via a Web interface.
Figure 3
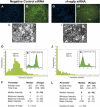
Single-cell level quantification of RNAi on a microarray platform. The imaging and quantification of fluorescence in HeLa/d2eGFP cells plated on two representative siRNA spots (a negative control cat siRNA spot [_A_-_F_] and an experimental rh-egfp siRNA spot [_G_-_L_], 2.5 ng of siRNA per spot) on a microarray slide. To quantify the effect of the siRNAs on GFP silencing, green fluorescence DAPI-stained nuclei (A,G) and “watershed” boundaries (defined using the green fluorescence images, B and H) were used to locate and define the area for the cells (white) in each of the two images (C and I; see Supplemental Fig. A). These segmented images were used to measure single-cell parameters used in subsequent data analysis (Supplemental Material, data sets 1 and 2). (D,J) For each spot, the distribution of the median green fluorescence (after local background fluorescence subtraction) in every segmented cell was plotted. A cell was considered to be positive for eGFP green fluorescence when its median fluorescence intensity was >4 units in the green channel. The distributions of the median green fluorescence intensities obtained by microarray analysis (D,J) were compared with traditional flow cytometric measurements of Hela/d2eGFP cells (10,000 events) transfected with the same siRNAs (E,K). The vertical line indicates the estimated level of background fluorescence. The degree of gene silencing detected by flow cytometry was consistent with that detected by the RNAi microarray imaging system. Statistical analysis (F,L) indicated a decrease in the green fluorescence intensities when the data fromthe cat siRNA and an rh-egfp siRNA spot were compared, whereas other parameters, such as the total cell area and nuclear area were similar in the two spots.
Figure 4
Assessment of the sensitivity and specificity of the RNAi microarray platform. (A) An analysis of eGFP expression (median green fluorescence intensity) in HeLa/d2eGFP cells over time following exposure to either arrayed egfp (black bars) or negative control (cat) siRNAs (gray bars; 2.5 ng siRNA per spot). The inhibition of eGFP expression by arrayed egfp siRNAs (black bars) is dose-dependent (0.25 ng, 1 ng, or 2.5 ng of siRNAs), and this effect can be observed over time. (B) 24 h; (C) 72 h. No change was seen in the fluorescence intensity of Hela/d2eGFP cells exposed to the negative control cat siRNAs (gray bars). (D) Cells exposed to arrayed siRNAs (negative control, gray bars; experimental siRNAs, black bars) were of the same size and were otherwise comparable; see Supplemental Material for additional statistics. Three different siRNAs against egfp were compared for their ability to inhibit eGFP expression using RNAi microarray (2.5 ng siRNA) (E) and flow cytometry (2 μg siRNA was transfected using Lipofectin into ∼2 × 10⁵ HeLa/d2eGFP cells) (F). (_A_-E) The average median green fluorescence of triplicate siRNA spots is plotted with the error bar representing 1 SD; (F) the average geometric mean green fluorescence of three independent transfections is plotted with the error bar representing 1 SD.
Similar articles
- High-throughput selection of effective RNAi probes for gene silencing.
Kumar R, Conklin DS, Mittal V. Kumar R, et al. Genome Res. 2003 Oct;13(10):2333-40. doi: 10.1101/gr.1575003. Genome Res. 2003. PMID: 14525931 Free PMC article. - [Specific inhibition of hTERT gene expression by short interfering RNAs in gastric cancer SGC7901 cell].
Ma JP, Zhan WH, Wang JP, Peng JS, Gao JS, Yin QW. Ma JP, et al. Zhonghua Wai Ke Za Zhi. 2004 Nov 22;42(22):1372-6. Zhonghua Wai Ke Za Zhi. 2004. PMID: 15634407 Chinese. - [Detection of RNA interference in nasopharyngeal carcinoma cell lines using reporter genes].
Yin ZH, Ren CP, Li F, Jiang WH, Yang XY, Feng XL, Yao KT. Yin ZH, et al. Ai Zheng. 2005 Mar;24(3):371-5. Ai Zheng. 2005. PMID: 15757546 Chinese. - High-throughput gene silencing using cell arrays.
Vanhecke D, Janitz M. Vanhecke D, et al. Oncogene. 2004 Nov 1;23(51):8353-8. doi: 10.1038/sj.onc.1208027. Oncogene. 2004. PMID: 15517016 Review. - RNA interference (RNAi) in hematology.
Scherr M, Steinmann D, Eder M. Scherr M, et al. Ann Hematol. 2004 Jan;83(1):1-8. doi: 10.1007/s00277-003-0759-1. Epub 2003 Oct 22. Ann Hematol. 2004. PMID: 14574462 Review.
Cited by
- Functional studies on transfected cell microarray analysed by linear regression modelling.
Fjeldbo CS, Misund K, Günther CC, Langaas M, Steigedal TS, Thommesen L, Laegreid A, Bruland T. Fjeldbo CS, et al. Nucleic Acids Res. 2008 Sep;36(15):e97. doi: 10.1093/nar/gkn428. Epub 2008 Jul 15. Nucleic Acids Res. 2008. PMID: 18628295 Free PMC article. - Quantitative analysis of highly parallel transfection in cell microarrays.
Baghdoyan S, Roupioz Y, Pitaval A, Castel D, Khomyakova E, Papine A, Soussaline F, Gidrol X. Baghdoyan S, et al. Nucleic Acids Res. 2004 May 21;32(9):e77. doi: 10.1093/nar/gnh074. Nucleic Acids Res. 2004. PMID: 15155824 Free PMC article. - Integrative functional genomics analysis of sustained polyploidy phenotypes in breast cancer cells identifies an oncogenic profile for GINS2.
Rantala JK, Edgren H, Lehtinen L, Wolf M, Kleivi K, Vollan HK, Aaltola AR, Laasola P, Kilpinen S, Saviranta P, Iljin K, Kallioniemi O. Rantala JK, et al. Neoplasia. 2010 Nov;12(11):877-88. doi: 10.1593/neo.10548. Neoplasia. 2010. PMID: 21082043 Free PMC article. - MicroSCALE screening reveals genetic modifiers of therapeutic response in melanoma.
Wood KC, Konieczkowski DJ, Johannessen CM, Boehm JS, Tamayo P, Botvinnik OB, Mesirov JP, Hahn WC, Root DE, Garraway LA, Sabatini DM. Wood KC, et al. Sci Signal. 2012 May 15;5(224):rs4. doi: 10.1126/scisignal.2002612. Sci Signal. 2012. PMID: 22589389 Free PMC article. - Life on a microarray: assessing live cell functions in a microarray format.
Papp K, Szittner Z, Prechl J. Papp K, et al. Cell Mol Life Sci. 2012 Aug;69(16):2717-25. doi: 10.1007/s00018-012-0947-z. Epub 2012 Mar 4. Cell Mol Life Sci. 2012. PMID: 22391673 Free PMC article. Review.
References
- Ashrafi, K., Chang, F.Y., Watts, J.L., Fraser, A.G., Kamath, R.S., Ahringer, J., and Ruvkun, G. 2003. Genome-wide RNAi analysis of Caenorhabditis elegans fat regulatory genes. Nature 421: 268-272. - PubMed
- Elbashir, S.M., Harborth, J., Lendeckel, W., Yalcin, A., Weber, K., and Tuschl, T. 2001. Duplexes of 21-nucleotide RNAs mediate RNA interference in cultured mammalian cells. Nature 411: 494-498. - PubMed
- Fire, A., Xu, S., Montgomery, M.K., Kostas, S.A., Driver, S.E., and Mello, C.C. 1998. Potent and specific genetic interference by double-stranded RNA in Caenorhabditis elegans. Nature 391: 806-811. - PubMed
- Frankish, H. 2003. Consortium uses RNAi to uncover genes' function. Lancet 361: 584. - PubMed
WEB SITE REFERENCES
- http://genetics.med.harvard.edu/~perrimon/RNAiGenomeProject.html; RNAi Genome Project.
Publication types
MeSH terms
Substances
LinkOut - more resources
Full Text Sources
Other Literature Sources


