OXBench: a benchmark for evaluation of protein multiple sequence alignment accuracy - PubMed (original) (raw)
Comparative Study
OXBench: a benchmark for evaluation of protein multiple sequence alignment accuracy
G P S Raghava et al. BMC Bioinformatics. 2003.
Abstract
Background: The alignment of two or more protein sequences provides a powerful guide in the prediction of the protein structure and in identifying key functional residues, however, the utility of any prediction is completely dependent on the accuracy of the alignment. In this paper we describe a suite of reference alignments derived from the comparison of protein three-dimensional structures together with evaluation measures and software that allow automatically generated alignments to be benchmarked. We test the OXBench benchmark suite on alignments generated by the AMPS multiple alignment method, then apply the suite to compare eight different multiple alignment algorithms. The benchmark shows the current state-of-the art for alignment accuracy and provides a baseline against which new alignment algorithms may be judged.
Results: The simple hierarchical multiple alignment algorithm, AMPS, performed as well as or better than more modern methods such as CLUSTALW once the PAM250 pair-score matrix was replaced by a BLOSUM series matrix. AMPS gave an accuracy in Structurally Conserved Regions (SCRs) of 89.9% over a set of 672 alignments. The T-COFFEE method on a data set of families with <8 sequences gave 91.4% accuracy, significantly better than CLUSTALW (88.9%) and all other methods considered here. The complete suite is available from http://www.compbio.dundee.ac.uk.
Conclusions: The OXBench suite of reference alignments, evaluation software and results database provide a convenient method to assess progress in sequence alignment techniques. Evaluation measures that were dependent on comparison to a reference alignment were found to give good discrimination between methods. The STAMP Sc Score which is independent of a reference alignment also gave good discrimination. Application of OXBench in this paper shows that with the exception of T-COFFEE, the majority of the improvement in alignment accuracy seen since 1985 stems from improved pair-score matrices rather than algorithmic refinements. The maximum theoretical alignment accuracy obtained by pooling results over all methods was 94.5% with 52.5% accuracy for alignments in the 0-10 percentage identity range. This suggests that further improvements in accuracy will be possible in the future.
Figures
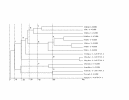
Figure 1
An example of the creation of sequence similar sub-families for Family 10 showing the families created at different cut-offs. For a full explanation see "Master data set" in the Results section.
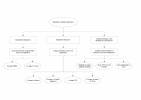
Figure 2
Flowchart outlining the relationship between the OXBench data sets and subsets. A non-redundant set of 218 structural domain families leads to the Master data set of 672 families by following the method outlined in Figure 1. The Master Data Set has additional sequences added to it to make the "Extended Data Set" and the sequences in the Master Data Set are made full-length in order to create the "Full-length Sequence Data Set". The Master Data Set is subdivided to create the test and training data sets as well as a set of two-sequence families (Pairwise Families), families with 8 or less sequences (MSA Data Set) and a set of families with more than two sequences in each family (Multiple Families). These families provide a range of different test data for multiple and pairwise alignment methods.
Figure 3
The families in the Master Data Set ordered by a) Percentage Identity (PID); b) STAMP [25] S_c_ structural similarity score; c) length of alignment; and d) number of domains/sequences in the family.
Figure 4
Graph showing the ratio of number of sequences in each family extended by adding additional sequences to the sequences in the family in the Master Data Set.
Figure 5
Graph showing the ratio of the number of residues in the family in the full-length sequence family to the number of residues in the family in the Master Data Set.
Figure 6
Distribution of families in the two test/training subsets of the Master data set sorted by percentage identity (PID).
Figure 7
Summary of the measures used to evaluate alignment quality that are discussed in this paper. "Independent Measures" are those that do not compare an alignment to a reference alignment, but compare the superimposed structures implied by an alignment. "Dependent Measures" compare an alignment to a reference alignment. The Graphical Display Tools highlight differences in alignment between the reference alignment and a test alignment. An example output is shown in Figure: 8. For definitions of terms used in this Figure, see Results.
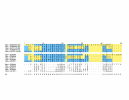
Figure 8
Comparison of an alignment generated by AMPS (PAM250 matrix, gap-penalty 6, tree order) and the reference structural alignment of Family 75 (Ferredoxin-like). The top block shows the AMPS alignment which contains the name of each domain, average PSE (in brackets) and the multiple alignment. The second block shows the reference multiple alignment obtained by 3D-structure comparison with STAMP [25]. The third block shows the secondary structure as determined by DSSP [26] and aligned in the same way as for the reference alignment. The Structurally Conserved Regions (SCRs) as determined by the STAMP multiple structure alignment program are boxed. Symbol 'H' in the "Pij" row indicates a STAMP [25] P_ij_ value of 10 or higher when aligning the least similar pair of structural sub-familes in the alignment. Thus, the boxed regions show regions where the reference alignment is most reliable. Outside these regions, the proteins either do not share the same conformation, or STAMP will not label them as confidently aligned. Residues where the alignment agrees with the reference are shown with a blue background, while residues that disagree are shown with a yellow background. The Figure is produced by ALSCRIPT [41] from commands generated by OXBench software. See text for further discussion of this alignment.
Figure 9
Graph showing the difference between multiple alignment accuracy and pairwise alignment accuracy for AMPS for all pairs from families with more than two members in the Master data set. A positive difference indicates better accuracy on multiple alignment.
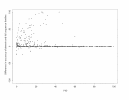
Figure 10
The difference in Acc_SCR_ for domain families and Full-length Sequence Families. The alignment was obtained by AMPS using BLOSUM75 and a penalty of 10 with NAS for clustering. Positive values show alignments that have higher accuracy when only the domains are compared relative to the full-length sequences that contain the domains. Data are plotted against the percentage sequence identity (PID).
Similar articles
- BAliBASE 3.0: latest developments of the multiple sequence alignment benchmark.
Thompson JD, Koehl P, Ripp R, Poch O. Thompson JD, et al. Proteins. 2005 Oct 1;61(1):127-36. doi: 10.1002/prot.20527. Proteins. 2005. PMID: 16044462 - DIALIGN-T: an improved algorithm for segment-based multiple sequence alignment.
Subramanian AR, Weyer-Menkhoff J, Kaufmann M, Morgenstern B. Subramanian AR, et al. BMC Bioinformatics. 2005 Mar 22;6:66. doi: 10.1186/1471-2105-6-66. BMC Bioinformatics. 2005. PMID: 15784139 Free PMC article. - Multiple sequence alignment.
Edgar RC, Batzoglou S. Edgar RC, et al. Curr Opin Struct Biol. 2006 Jun;16(3):368-73. doi: 10.1016/j.sbi.2006.04.004. Epub 2006 May 5. Curr Opin Struct Biol. 2006. PMID: 16679011 Review. - T-Coffee: A novel method for fast and accurate multiple sequence alignment.
Notredame C, Higgins DG, Heringa J. Notredame C, et al. J Mol Biol. 2000 Sep 8;302(1):205-17. doi: 10.1006/jmbi.2000.4042. J Mol Biol. 2000. PMID: 10964570 - Protein database searches using compositionally adjusted substitution matrices.
Altschul SF, Wootton JC, Gertz EM, Agarwala R, Morgulis A, Schäffer AA, Yu YK. Altschul SF, et al. FEBS J. 2005 Oct;272(20):5101-9. doi: 10.1111/j.1742-4658.2005.04945.x. FEBS J. 2005. PMID: 16218944 Free PMC article. Review.
Cited by
- An enhanced RNA alignment benchmark for sequence alignment programs.
Wilm A, Mainz I, Steger G. Wilm A, et al. Algorithms Mol Biol. 2006 Oct 24;1:19. doi: 10.1186/1748-7188-1-19. Algorithms Mol Biol. 2006. PMID: 17062125 Free PMC article. - Benchmark datasets and software for developing and testing methods for large-scale multiple sequence alignment and phylogenetic inference.
Linder CR, Suri R, Liu K, Warnow T. Linder CR, et al. PLoS Curr. 2010 Nov 18;2:RRN1195. doi: 10.1371/currents.RRN1195. PLoS Curr. 2010. PMID: 21113335 Free PMC article. - Jalview Version 2--a multiple sequence alignment editor and analysis workbench.
Waterhouse AM, Procter JB, Martin DM, Clamp M, Barton GJ. Waterhouse AM, et al. Bioinformatics. 2009 May 1;25(9):1189-91. doi: 10.1093/bioinformatics/btp033. Epub 2009 Jan 16. Bioinformatics. 2009. PMID: 19151095 Free PMC article. - Application of the MAFFT sequence alignment program to large data-reexamination of the usefulness of chained guide trees.
Yamada KD, Tomii K, Katoh K. Yamada KD, et al. Bioinformatics. 2016 Nov 1;32(21):3246-3251. doi: 10.1093/bioinformatics/btw412. Epub 2016 Jul 4. Bioinformatics. 2016. PMID: 27378296 Free PMC article. - eProbalign: generation and manipulation of multiple sequence alignments using partition function posterior probabilities.
Chikkagoudar S, Roshan U, Livesay D. Chikkagoudar S, et al. Nucleic Acids Res. 2007 Jul;35(Web Server issue):W675-7. doi: 10.1093/nar/gkm267. Epub 2007 May 7. Nucleic Acids Res. 2007. PMID: 17485479 Free PMC article.
References
- Taylor WR. Identification of protein sequence homology by consensus template alignment. J Mol Biol. 1986;188:233–258. - PubMed
- Barton GJ. Protein sequence alignment and database scanning. In: Sternberg MJE, editor. In Protein structure prediction: A practical approach. Oxford: IRL Press at Oxford University Press; 1996. pp. 31–63.
- Livingstone CD, Barton GJ. Protein sequence alignments: a strategy for the hierarchical analysis of residue conservation. Comput Appl Biosci. 1993;9:745–756. - PubMed
- Barton GJ, Sternberg MJ. Evaluation and improvements in the automatic alignment of protein sequences. Protein Eng. 1987;1:89–94. - PubMed
Publication types
MeSH terms
Substances
LinkOut - more resources
Full Text Sources
Other Literature Sources
Molecular Biology Databases


